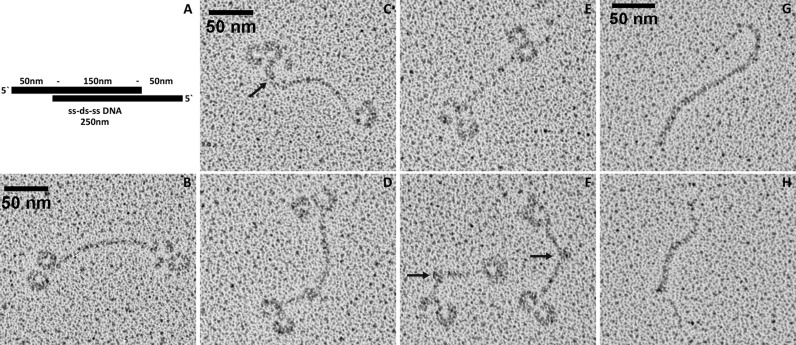
Figure 5.
The CpMgm101–DNA complex visualized by electron microscopy. (A) Graphical representation of the ss-ds-ss DNA template (250 ± 30 nm) with the dsDNA region at the center (150 nm) and long 5′ ssDNA overhangs at the ends (50 nm), (B–F) representative EM pictures of CpMgm101 bound to a model telomere (see ‘Materials and Methods’ section). Note the formation of circular structures at the single-stranded ends. These structures are about 20 nm across. The arrow in panel (C) indicates a junction between a Mgm101-bound ssDNA segment and an unbound dsDNA segment. The arrows in panel (F) indicate the formation of bends and loops within the double-stranded part of the DNA molecules. (G and H) control EM pictures of the DNA template alone. The scale bar is 50 nm in length.

