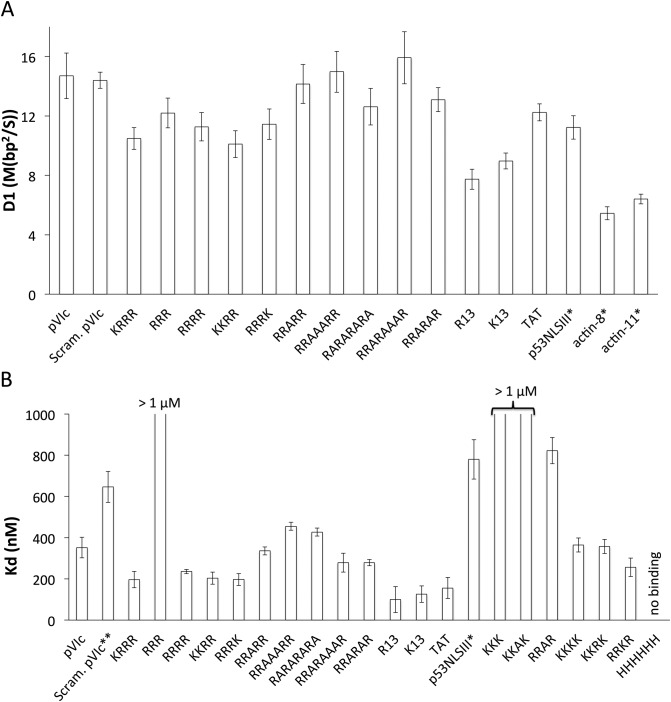
Figure 2.
(A) The estimated D1 values for a panel of different peptides sliding on DNA in 2 mM NaCl buffer. TMR or Cy3 were conjugated to the N-terminus of all peptides except for actin-8 and actin-11 in which Cy3B was conjugated to the cysteine residues present in these peptides. D1 values measured at pH 7.4 and 6.5 were combined for all peptides except for actin-8 and actin-11 whose D1 values were measured only at pH 6.5. All the error bars are standard errors of the mean. On average, over 50 trajectories were analyzed to estimate each D1 value. (B) Equilibrium dissociation constants, Kd values of different peptides binding to a 30 bp dsDNA in 2 mM NaCl buffer at pH 7.4, determined by fluorescence polarization measurements. TMR was conjugated to the N-terminus. * Result from Mangel et al. (9). ** Result from personal communication with Dr. Walter Mangel. All the error bars are standard errors of the mean. The Kd values were averaged from at least three independent measurements. See Supplementary Table S1 for D1 and Kd values.

