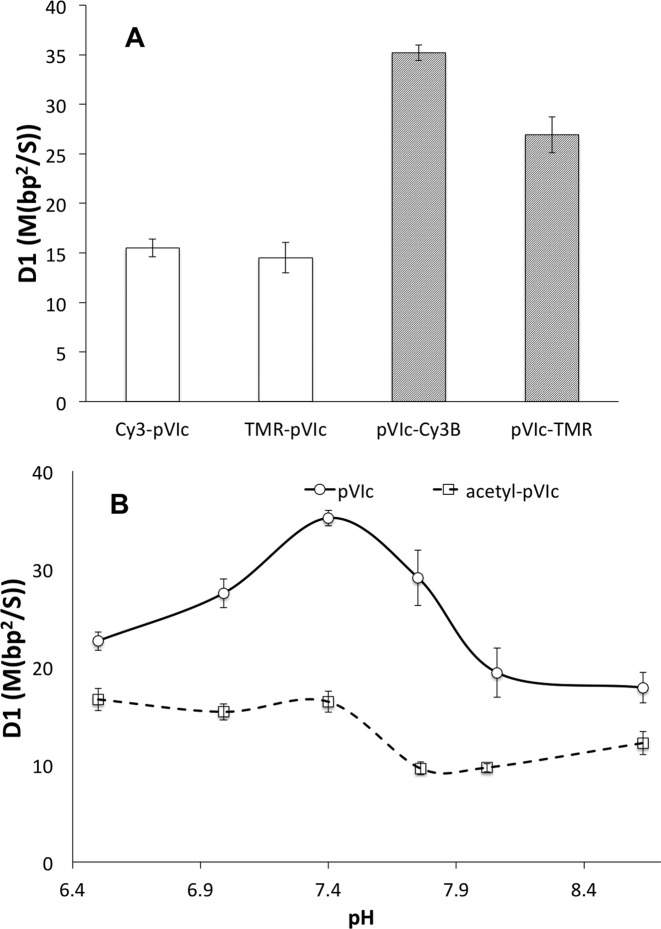
Figure 3.
(A) The estimated D1 values of Cy3-pVIc, TMR-pVIc, pVIc-Cy3B and pVIc-TMR in 2 mM NaCl buffer at pH 7.4. TMR or Cy3 was conjugated to the N-terminus or Cys residues. (B) The pH dependence of D1 of pVIc (solid line) and acetyl-pVIc (dashed line) in 2 mM NaCl buffer. Cy3B was conjugated to Cys residues. See Supplementary Table S2 for D1 values. All the error bars are standard errors of the mean. On average, over 50 trajectories were analyzed to estimate each D1 value.

