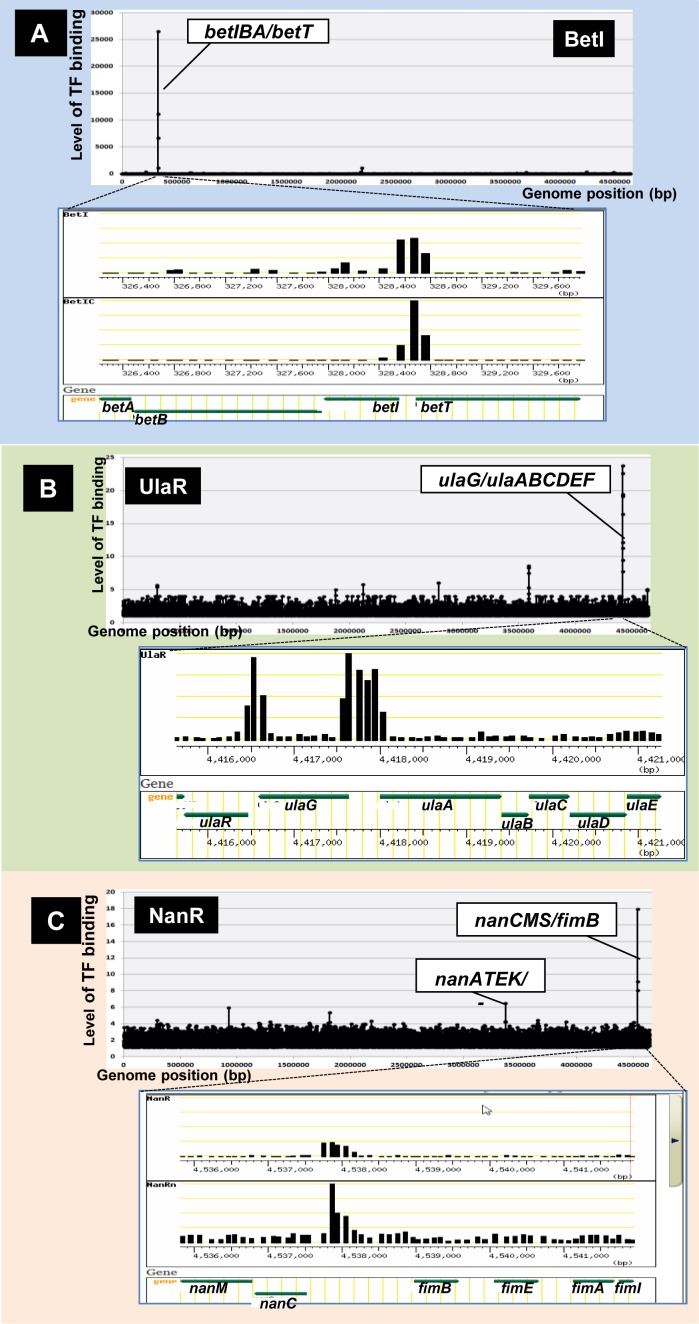
Figure 2.
Single-target TFs. After in vitro SELEX screening of DNA-binding sequences of purified TFs, their regulatory targets were predicted based on their binding sites, as noted in Figure 1C. Among 156 SELEX patterns examined for 116 TFs, a small number of TFs regulated only one specific target operon. Some representative SELEX patterns are shown: (A) BetI: (B) UlaR; and (C) NanR. For each SELEX pattern, the upper panel shows the genome-wide distribution of TF-binding sites, whereas the lower panel shows the expanded local region of a TF-binding site [note that the expanded patterns were retrieved from TEC (Transcription Profile of Escherichia coli) database]. The Y-axis indicates the fluorescent intensity of SELEX fragment binding to each probe relative to that of library DNA. The Y-axis in each expanded image indicates the level of each peak relative to that of the highest peak.

