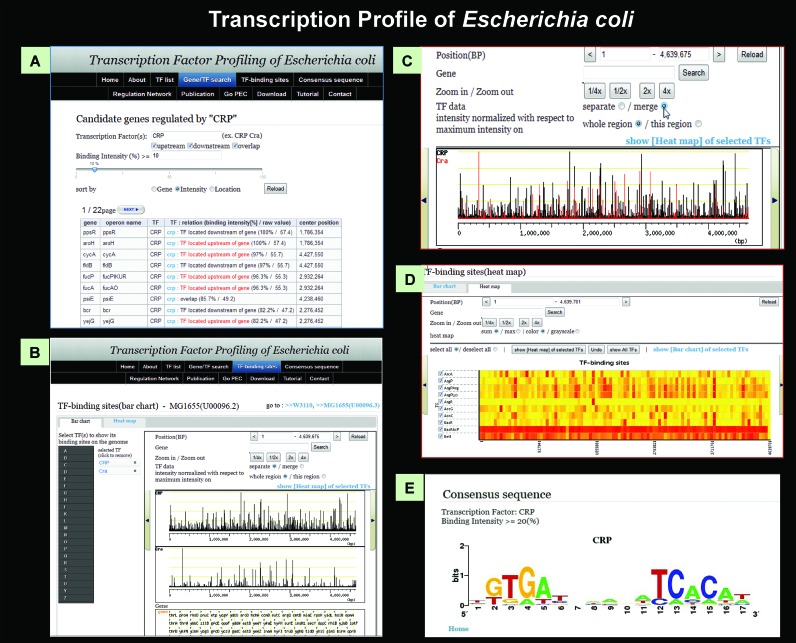
Figure 7.
TEC database. All SELEX patterns described herein are compiled in the TEC database. Using this database, various types of analysis are possible: (A) search for the list of regulatory targets under direct control of each TF. (B) The location of binding peaks of a test TF along the entire E. coli genome can be visualized at various scales, from the whole genome to restricted areas. (C) The relative location of binding sites of different TFs can be visualized on various scales. (D) Heat map of binding intensity of test TFs along the entire E. coli genome. (E) Search for the consensus sequence of TF binding, using the whole set of TF-binding sequences.

