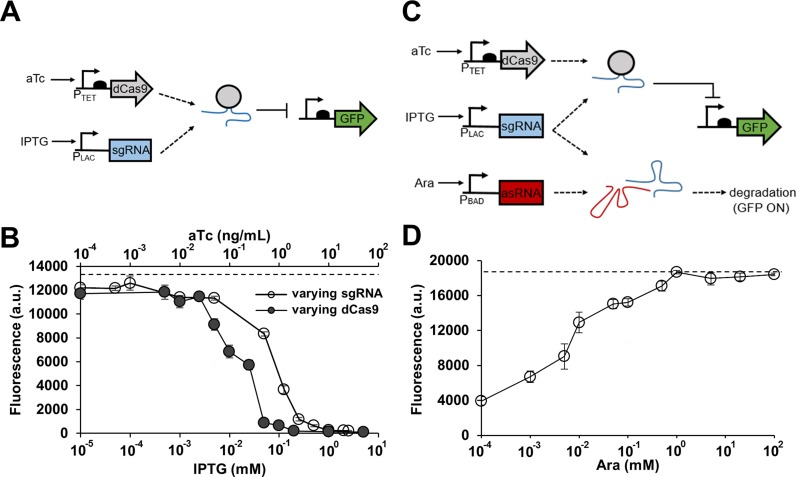
Figure 1.
Combining CRISPR and antisense RNA systems. (A) A genetic circuit containing the CRISPR system only. An sgRNA-dCas9 complex represses GFP in the presence of aTc and IPTG. (B) The CRISPR circuit shown in (A) was tested by varying sgRNA (sgR14) or dCas9 expression level. GFP is under the control of the constitutive Bba J23104 promoter. Cells were grown in the presence of either 10 ng/ml aTc (constant dCas9) with different IPTG concentrations (0, 0.00005, 0.0001, 0.001, 0.005, 0.05, 0.125, 0.25, 0.5, 1, 2 and 2.5 mM; open circle) or 1 mM IPTG (constant sgRNA) with different aTc concentrations (0, 0.005, 0.01, 0.025, 0.05, 0.1, 0.25, 0.5, 1, 2, 10 and 50 ng/ml; filled circle). The fluorescence (a.u.) was reported by calculating [(Fexperimental/Absexperimental) – (Fnegative control/Absnegative control)] where negative control is the JTK165JK strain with no plasmid, F is the measured fluorescence (excitation at 483 nm and emission at 530 nm) and Abs is the measured absorbance at 600 nm. The dashed line represents the fluorescence of cells grown without any inducer. (C) A genetic circuit built by combining the CRISPR system with antisense RNA (asRNA). Transcribed asRNA binds to its target sgRNA and prevents the sgRNA-dCas9 complex from repressing GFP. GFP is ‘on’ when asRNA is present, and GFP is ‘off’ when asRNA is absent. (D) Response of the combined CRISPR and antisense RNA system (asRS4) shown in (C). GFP is under the control of the constitutive Bba J23104 promoter. All samples were grown in the presence of 0.2 ng/ml aTc and 0.25 mM IPTG, and with different Ara concentrations (0, 0.001, 0.005, 0.01, 0.05, 0.1, 0.5, 1, 5, 20 and 100 mM). The fluorescence (a.u.) was measured using a microplate reader and reported by calculating [(Fexperimental/Absexperimental) – (Fnegative control/Absnegative control)] where the negative control is JTK165JK with no plasmid. The dashed line represents the fluorescence of cells grown without any inducer. See Supplementary Figure S1 for the fluorescence and Abs600 data without normalization. The error bars represent the standard deviation of the fluorescence values from three biological replicates performed on three different days.

