Figure 2.
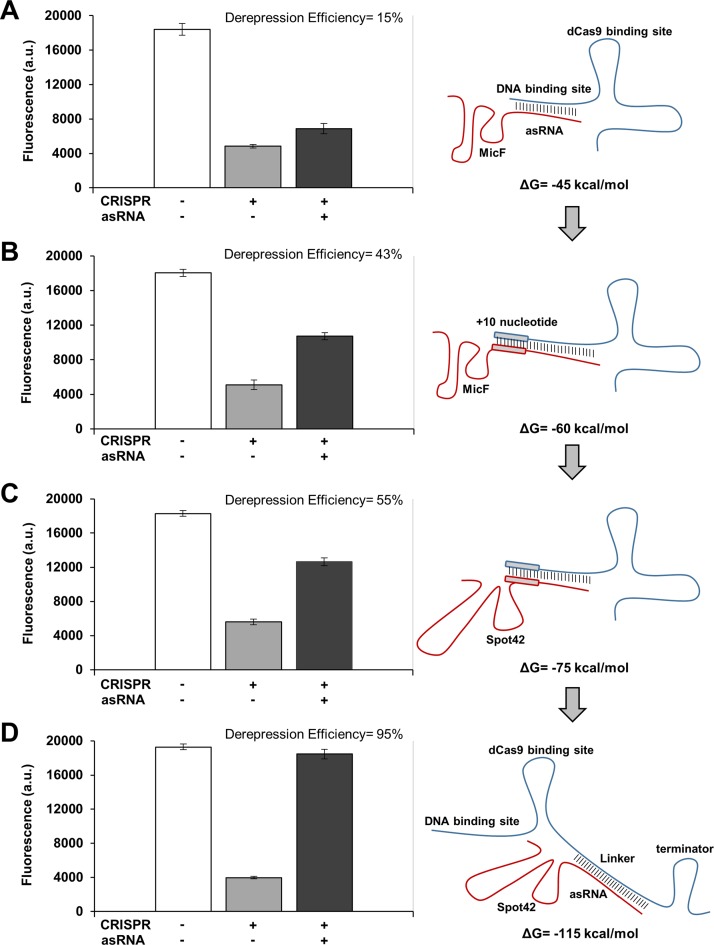
Improvements in derepression efficiencies by changing system parameters. (A) Repression and derepression of GFP by sgR14-dCas9 and asR124, respectively. asR124 targets the DNA binding site of sgR14, and this construct resulted in a derepression efficiency of 15%. (B) An increase in the binding affinity between sgR14 and asR124 was achieved by introducing an additional 10 nucleotides (annotated as sgR14A and asR124A). This construct resulted in a derepression efficiency of 43%. (C) Replacement of MicF (an Hfq binding site) with Spot42 increased the derepression efficiency to 55%. sgR14A and asR124A fused to Spot42 were used for this system. (D) The derepression efficiency was increased to 95% by designing asRS4, which targets T4, an artificially introduced linker region (annotated as sgR14-T4). For all constructs (see Figure 1C for the schematic), ΔG was calculated by using NUPACK at 37°C (10). GFP is under the control of the constitutive Bba J23104 promoter. Derepression efficiency was calculated by [(FCRISPR, asRNA/AbsCRISPR, asRNA – FCRISPR/AbsCRISPR) / (Fpositive control/Abspositive control – FCRISPR/AbsCRISPR)] × 100% where the positive control is JTK165JK with both CRISPR and asRNA uninduced, and the subscript indicates induced systems. +, induced; -, uninduced. Cells were grown in the presence of 0.2 ng/ml aTc and 0.25 mM IPTG (+ for CRISPR); and for asRNA, without (−) or with (+) 5 mM Ara. The positive control (white bar) was grown without any inducer. See the Materials and Methods section for details and Supplementary Figure S3 for the entire data set obtained from all variant constructs for each category (A-D). The fluorescence (a.u.) was measured using a microplate reader. The error bars represent the standard deviation of the fluorescence values from three biological replicates performed on three different days.

