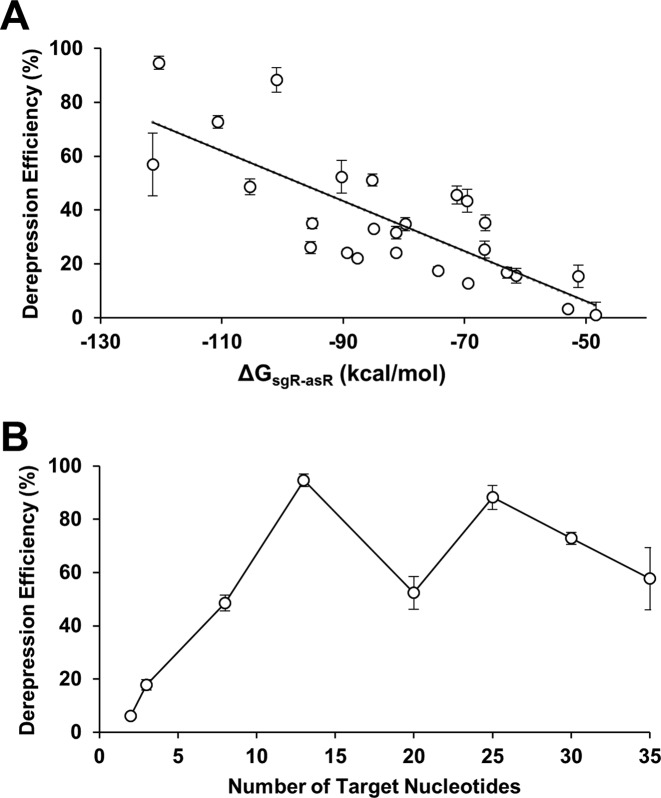
Figure 3.
Parameters that affect derepression efficiency. (A) A strong negative relationship between ΔG of sgRNA–asRNA and derepression efficiency was observed based on the correlation test (R2 = 0.62, P < 0.01). ΔG was estimated by NUPACK at 37°C (10). (B) A linear increase in derepression efficiency was observed as the number of target nucleotides increased (up to 13 nucleotides). A saturation effect (with a change in the predicted secondary structure) was observed beyond 13 nucleotides. See Supplementary Figure S3 for the fluorescence results of each point in (A) and Supplementary Figure S4 for the predicted sgRNA structure in (B). The error bars represent the standard deviation of derepression efficiencies from three biological replicates performed on three different days.

