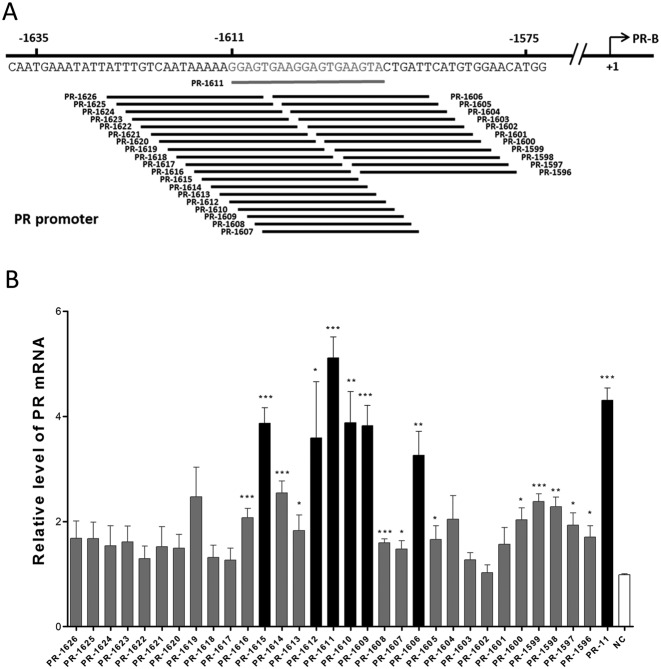
Figure 2.
A distal hotspot in the PR promoter for RNAa. (A) Schematic representation of 30 tiled saRNAs with each target shifted 1-nt around PR-1611. All potential targets of small RNAs in the region from −1626 to −1596 are included (the TSS is regarded as +1). (B) Plot of PR mRNA expression levels in MCF-7 cells after individual transfection with 30 tiled saRNAs. Cells were harvested after 72 h. PR mRNA expression levels were assessed by qPCR and normalized to GAPDH. The results are mean ± SEM of at least three independent experiments and plotted as relative expression compared to NC transfection. *P < 0.05; **P < 0.01; ***P < 0.001.

