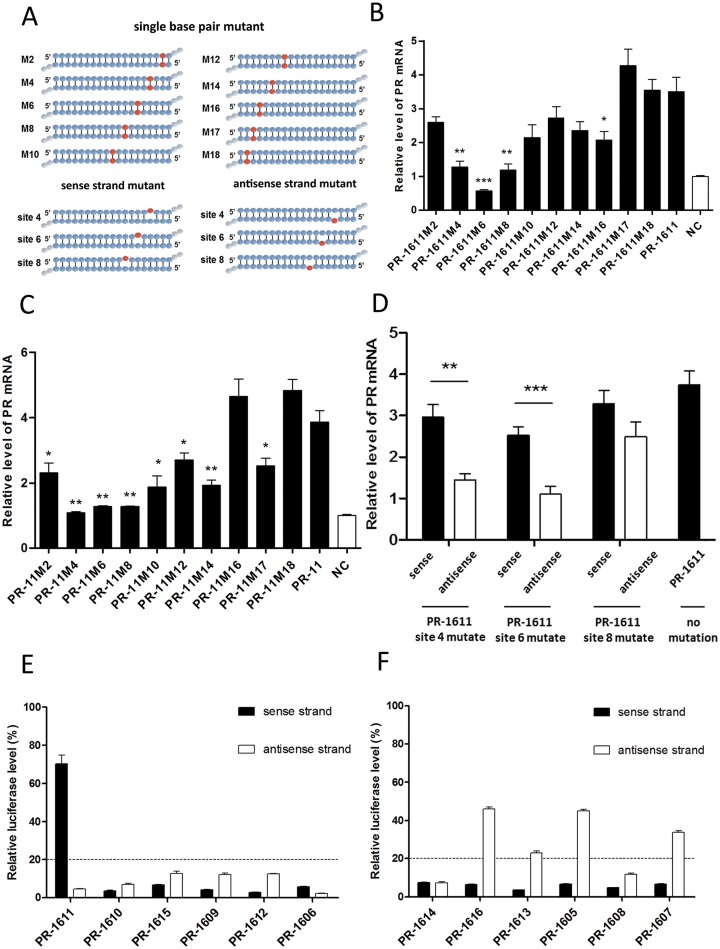
Figure 3.
Seed-region and guide strand of saRNA. (A) Schematic representation of saRNAs with single base-pair mutations and saRNAs with single-nucleotide mutations in the sense or antisense strand. (B and C) Plots of PR mRNA expression in MCF-7 cells after transfection with two series of mutant saRNAs, PR-1611-M2 to M18 (B) or PR-11-M2 to M18 (C). Statistical analysis was performed between the mutated saRNAs and wild-type saRNA. (D) Plot of PR mRNA expression in MCF-7 cells after transfection with single-nucleotide mutated saRNAs. The position of the mutated site is shown according to the antisense strand. PR mRNA expression levels were assessed by qPCR and normalized to GAPDH. (E and F) HEK293A cells were co-transfected with reporter carrying the target of sense or antisense strands of the corresponding small RNA. The relative luciferase levels of reporters of functional saRNAs (E) and non-functional saRNAs (F) were assessed using a dual-luciferase reporter assay system. The results are mean ± SEM of at least three independent experiments and plotted as relative expression compared to NC transfection. *P < 0.05; **P < 0.01; ***P < 0.001.

