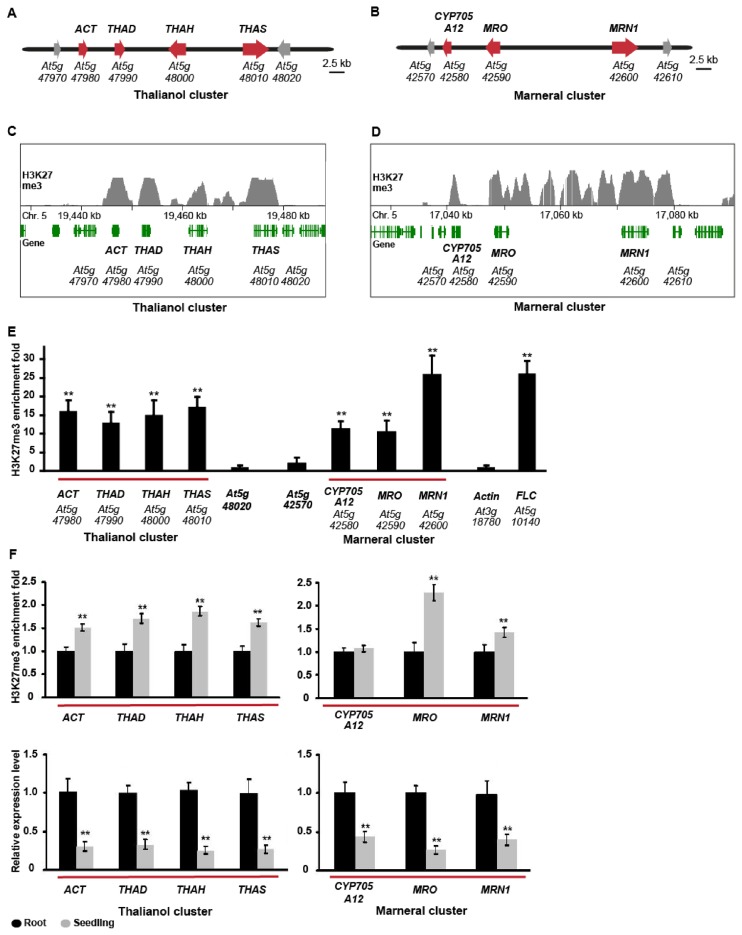
Figure 1.
Analysis of H3K27me3 marking and gene expression at the thalianol and marneral clusters. (A and B) The thalianol and marneral clusters. Red, cluster genes; grey, flanking genes. (C and D) H3K27me3 ChIP-on-chip data for the two clusters [data extracted from Zhang et al. (28)]. The dataset (GSE7064) was uploaded with the University of California, Santa Cruz (UCSC) Genome Browser (University of California, Los Angeles installation). Genes are indicated in green and ChIP-on-chip marks in grey. (E) H3K27me3 ChIP analysis of the thalianol and marneral clusters. Six day-old seedlings of Arabidopsis thaliana Col-0 were used. Controls were flanking genes, Actin and FLC (positive control). Cluster genes are underlined in red. **P (t-test) < 0.01 for FLC and cluster genes compared to flanking gene. (F) H3K27me3 ChIP analysis (top) and transcript levels (bottom) for the thalianol and marneral gene clusters in whole seedlings (grey bars) and roots (black bars). The error bars for the ChIP analysis indicate standard deviation for three biological replicates. Transcript levels were analysed by qPCR with Actin2 as the reference gene; data are shown as means ± sd of three biological replicates. **P < 0.01.

