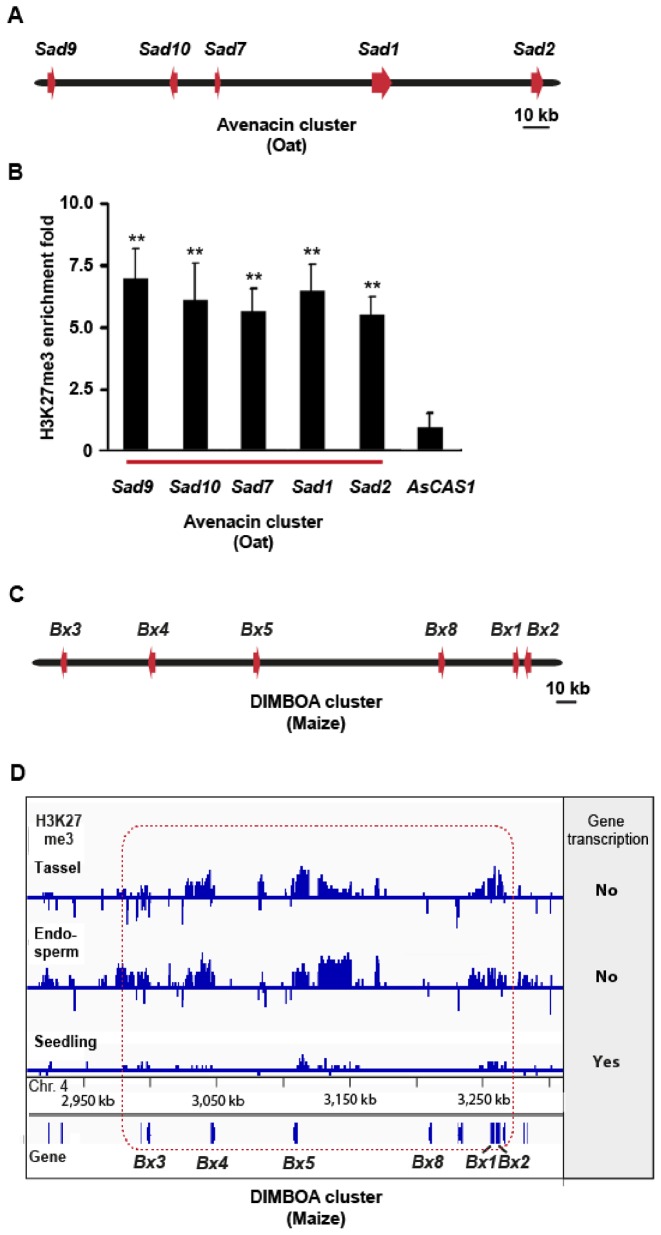
Figure 3.
Analysis of H3K27me3 markings at the oat avenacin cluster and the maize DIMBOA cluster. (A) The oat avenacin biosynthetic gene cluster. (B) H3K27me3 ChIP analysis of avenacin cluster genes. Roots of wild-type Avena strigosa seedlings (3-days old) were used. The A. strigosa cycloartenol synthase gene AsCAS1, which is unlinked to the cluster and is expressed throughout the leaves and roots, was included as a control. Error bars indicate standard deviation of three biological replicates. **P (t-test) < 0.01 for cluster genes compared to AsCAS1. (C) The Zea mays DIMBOA cluster. (D) ChIP-on-chip data showing H3K27me3 marking at the DIMBOA cluster [data extracted from Makarevitch et al. (39)]. The dataset (GSE39456) was uploaded with the Integrative Genomics Viewer (Broad Institute). Gene transcription states of the cluster as extracted from Makarevitch et al. (39) are indicated on the right. The DIMBOA gene cluster is framed in red.

