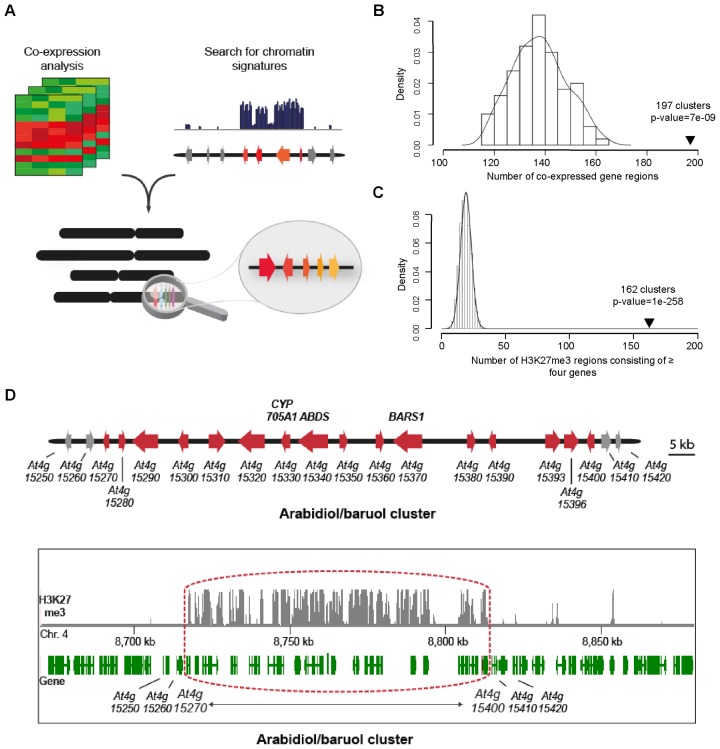
Figure 4.
Genome mining for clusters of co-expressed and H3K27me3 marked genes. (A) Schematic showing the overall strategy used. Co-expressed genes were identified by analysis of genome-wide gene expression datasets and physically clustered gene sets within these identified. Groups of physically linked genes with contiguous H3K27me3 markings were identified by examination of genome-wide ChIP-on-chip datasets. Comparison of the outputs of these two analyses led to the identification of gene clusters that were both co-expressed and H3K27me3-marked. (B) Co-expressed gene regions in Arabidopsis thaliana. The high stringency maximal clique graph-based method for identification of co-localized and co-expressed gene clusters identified 197 regions (Supplementary Data Set 1; see ‘Materials and Methods’ section for details). Statistical significance was determined by randomly shuffling the gene order on each chromosome and reapplying the same methodological approach to find co-expressed clusters on the artificial chromosomes. After shuffling 100 times, the clique method gave a mean of 138 clusters with a standard deviation of 10. This resulted in a P-value of 7 × 10⁻⁹, assuming a normal distribution. (C) H3K27me3 marked regions of ≥ four genes in A. thaliana. 4629 of the 27 206 chromosomal protein coding genes in the A. thaliana genome were found to be H3K27me3 methylated (28). A search for four or more adjacent genes marked with H3K27me3 yielded 162 regions (Supplementary Data Set 2). To test for statistical significance of these regions, the methylation pattern was randomly shuffled using the Fisher-Yates shuffle algorithm. After 10 000 shuffles, the mean number of strings of four or more H3K27me3-marked genes obtained was 19.0 with a standard deviation of 4.2. This resulted in a P-value of 1 × 10258, assuming a normal distribution. (D) H3K27me3 markings at the arabidiol/baruol gene cluster. Top, the arabidiol/baruol cluster (red, cluster genes; grey, flanking genes). Below, ChIP-on-chip H3K27me3 marking at the A. thaliana arabidiol/baruol cluster [data extracted from Zhang et al. (28)]. The dataset (GSE7064) was uploaded with the University of California, Santa Cruz (UCSC) Genome Browser (University of California, Los Angeles installation). Genes are indicated in green; ChIP-on-chip marks are shown in grey. The cluster is framed in red.

