
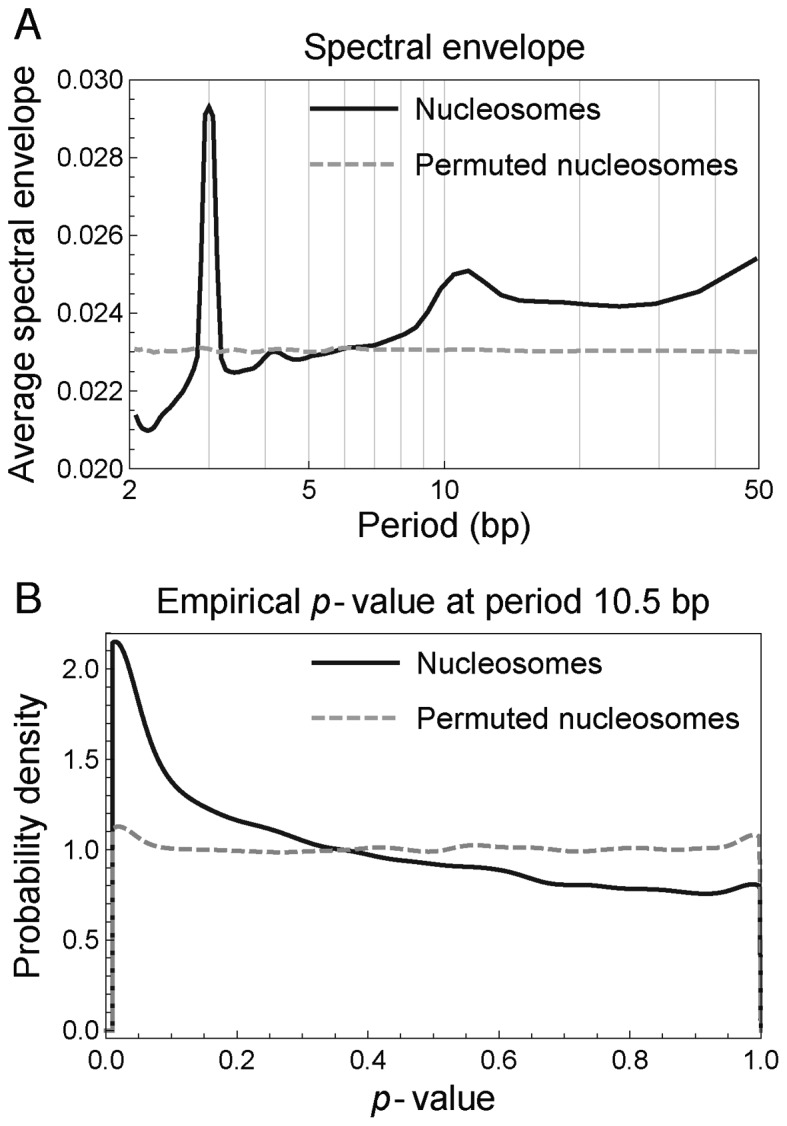
Figure 2.
Nucleosomal sequences in Saccharomyces cerevisiae have enriched 10.5-bp periodicity in mono-nucleotides compared to randomly permuted sequences. (A) Average mono-nucleotide spectral envelope of nucleosomal sequences (solid black curve) and randomly permuted sequences (dashed gray curve). (B) Distribution of p-values assessing the statistical significance of 10.5-bp periodicity in mono-nucleotides of nucleosomal sequences (solid black curve) and randomly permuted sequences (dashed gray curve).