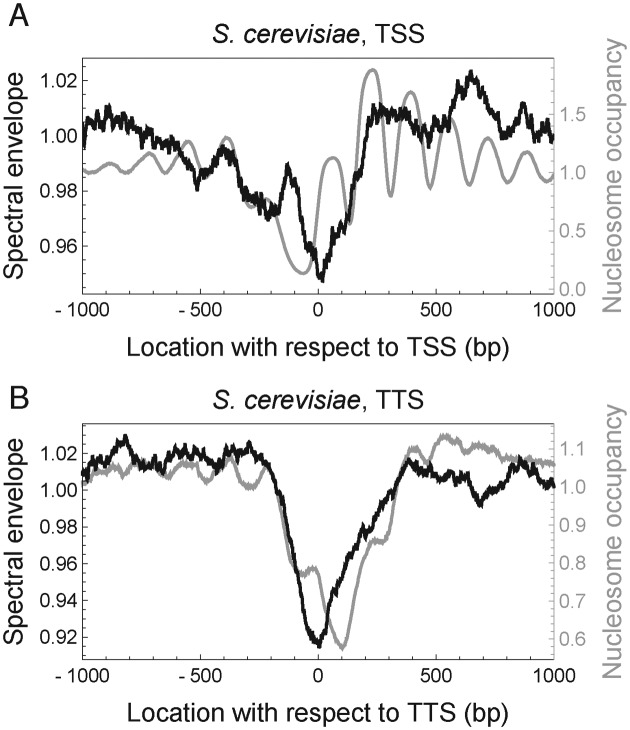
Figure 7.
Nucleosome-depleted regions in Saccharomyces cerevisiae contain reduced 10.5-bp periodicity. (A) Nucleosome occupancy (gray) and spectral envelope at 10.5 bp aligned at the TSS of 3005 genes. Black curve shows the average mono-nucleotide spectral envelope of running 147-bp windows centered at each location, normalized to the genome-wide mean. (B) Same as in (A), but aligned at TTS.

