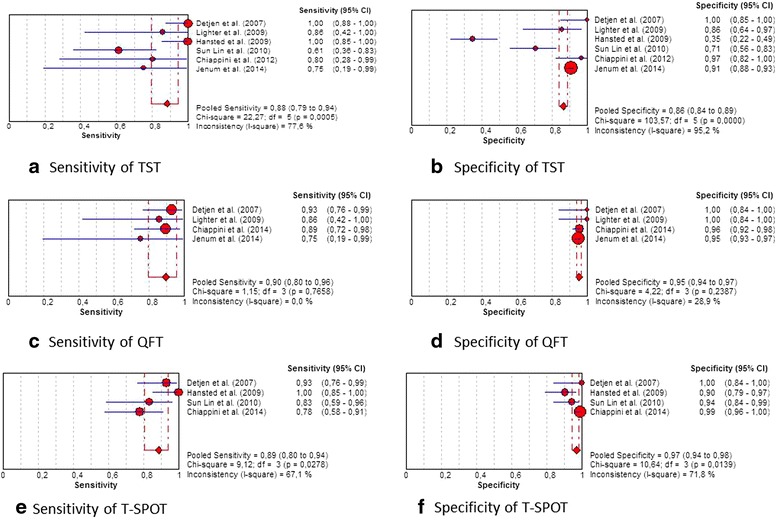
Fig. 3.

Plot of individual studies and pooled estimates of sensitivity and specificity. a sensitivity of TST, b specificity of TST, c sensitivity of QFT, d specificity of QFT, e sensitivity of T-SPOT, f specificity of T-SPOT

Plot of individual studies and pooled estimates of sensitivity and specificity. a sensitivity of TST, b specificity of TST, c sensitivity of QFT, d specificity of QFT, e sensitivity of T-SPOT, f specificity of T-SPOT