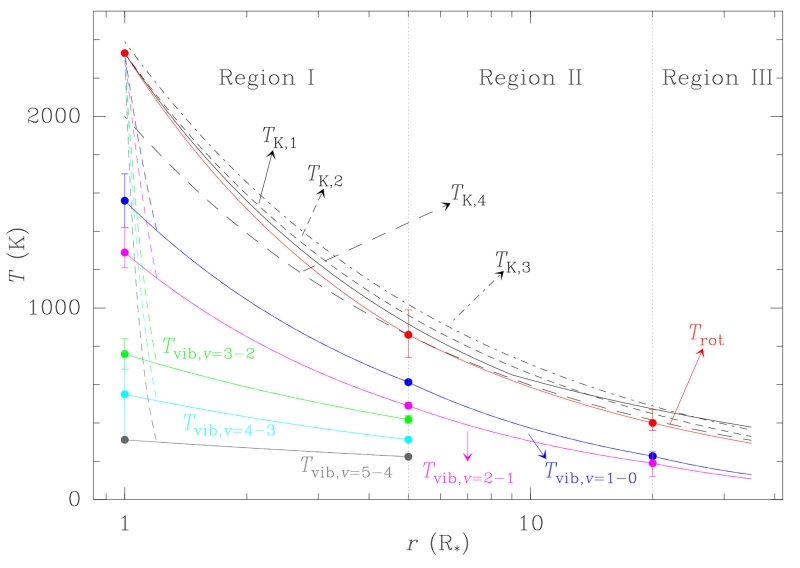
Figure 4.
Kinetic, rotational, and vibrational temperatures of 28Si32S from the stellar photosphere up to 35R⋆. The kinetic temperatures, Tk, derived in previous works (references 1, 2, 3, and 4) are plotted in solid, short dashed, dashed-dot, and long dashed, black lines. The rotational temperature, Trot, derived in the frame of the current work is plotted in solid red. The vibrational temperatures, Tvib, derived from ro-vibrational bands v = 1 – 0, 2 – 1, 3 – 2, 4 – 3, and 5 – 4 are plotted in blue, magenta, green, cyan, and grey solid lines, respectively. The dashed lines in these colours represent possible dependences of the vibrational temperatures on the distance to the star between the stellar photosphere and ≃ 1.2R⋆, where Cernicharo et al. (2013) propose a larger gas density than we assume in the current work. Tvib,v = 3 – 2, Tvib,v = 4 – 3, and Tvib,v = 5 – 4 are only plotted up to 5R⋆ because the lines of these bands are mostly formed in Region I and no information on larger distances to the star can be retrieved from them. References: (1) De Beck et al. (2012) (2) Agúndez et al. (2012) (3) Schöier et al. (2007) (4) Boyle et al. (1994)

