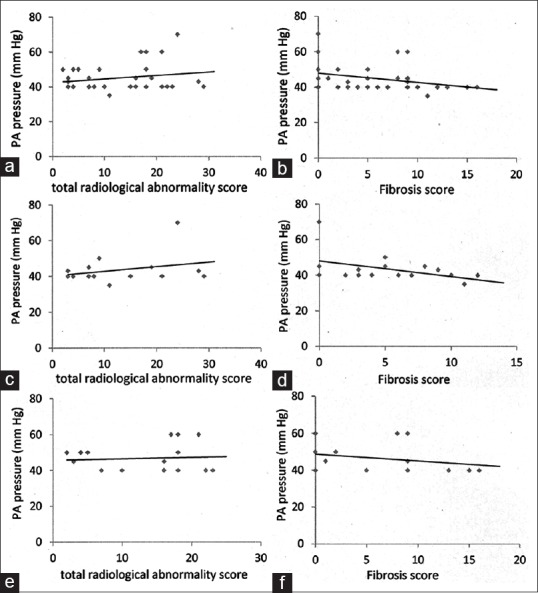
Figure 1.

The correlation of tuberculosis associated pulmonary artery pressure to the total score and the fibrosis score (in chest X-ray) has been displayed. The upper panel (a and b) shows the overall co-relationship while the intermediate panel (c and d) and the lower panel (e and f) show the co-relationship of the “chronic obstructive pulmonary disease phenotype” and the “diffuse parenchymal lung disease phenotype” with the total abnormality score and the fibrosis score
