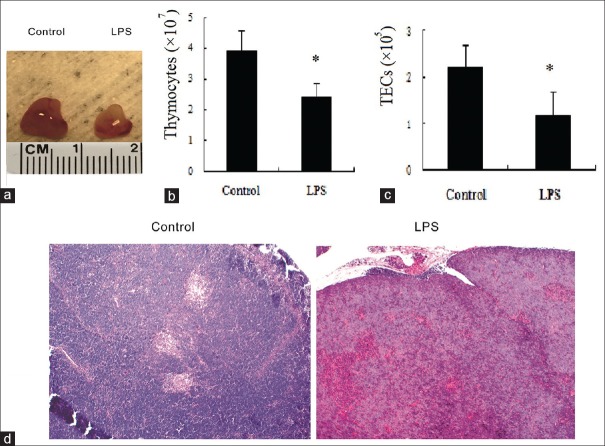
Figure 1.
Lipopolysaccharide-induced acute thymic atrophy. Mice were administered either phosphate buffer saline or lipopolysaccharide. (a) The size and appearance of thymus. (b) Total number of thymocytes. (c) Total number of thymic epithelial cells. (d) Representative hematoxylin-eosin stains (original magnification, ×10) of thymus for controls and 24-h lipopolysaccharide-exposed animals. Values are mean ± standard error (n = 6). *P < 0.05 with respect to the control mice. LPS: Lipopolysaccharide.

