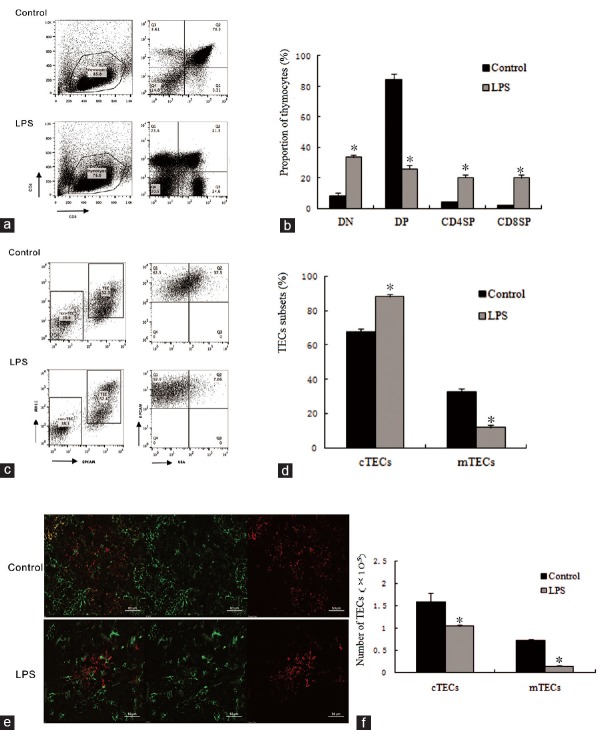
Figure 2.
Lipopolysaccharide-induced acute thymic atrophy and the cells subsets of thymus after a 24 h lipopolysaccharide treatment. (a) Representative flow cytometry plots of thymocyte subsets (CD4, CD8 double-negative [DN], double-positive [DP], or single-positive [SP]) were determined. (b) Proportion of thymocytes subsets. Percentage of thymocytes subsets were calculated based on the fluorescence-activated cell sorting profiles in the control and lipopolysaccharide treatment groups. (c) Representative flow cytometry plots of medullary thymic epithelial cells and cortical thymic epithelial cells. Cell subsets were determined based on the fluorescence-activated cell sorting profiles gated from CD45−EpCAM1+MHCII+cells, cortical thymic epithelial cells (CD45−EpCAM1+MHCII+UEA−) and medullary thymic epithelial cells (CD45−EpCAM1+MHCII+UEA+). (d) Frequency of thymic epithelial cells subsets were quantified by the fluorescence-activated cell sorting after a 24 h lipopolysaccharide challenge. (e) Immunohistochemical staining showed the thymic epithelial cell subsets, K5−K8+ cells (green-stained) represents cortical thymic epithelial cells, K5+K8− cells (red-stained) represents medullary thymic epithelial cells, and K5+K8+ cells (yellow-stained) represents thymic epithelial progenitors. Scar bar is 50 μm. (f) Total number of medullary thymic epithelial cells and cortical thymic epithelial cells determined by the fluorescence-activated cell sorting. Values are mean ± standard error (n = 5). *P < 0.05 with respect to the control mice. EpCAM: Epithelial cellular adhesion molecule; MHC: Major histocompatibility complex; UEA: Ulex europeus lectin; K: Keratin. LPS: Lipopolysaccharide; TECs: thymic epithelial cells; cTECs: cortical thymic epithelial cells; mTECs: medullary thymic epithelial cells.

