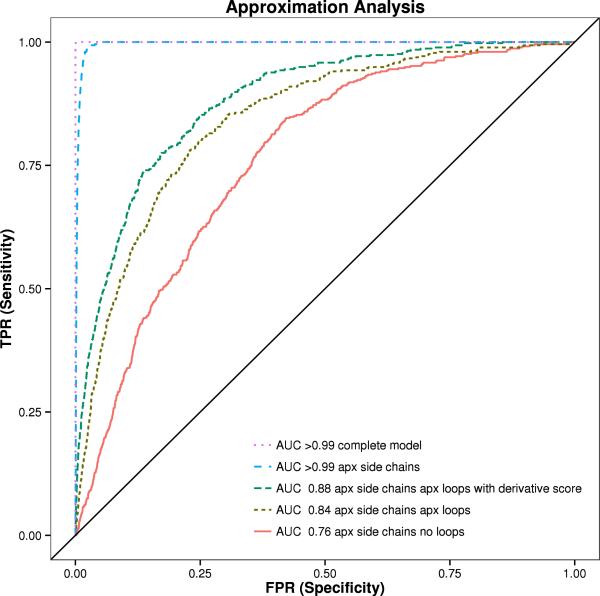
Figure 5. ROC Analysis of 455 proteins from Pisces dataset in different states.
The area under the curve (AUC) is shown with BCL::SAXS profiles generated for complete protein models (orange), models with approximated side chains (purple), approximated side chains and with loop approximation method (blue), approximated side chains without loop approximation method (red), and the derivative of the approximated side chains with the loop approximation method (green). The standard χ score was used to compare the profiles for all plots except for green, where the derivative χ score was used.

