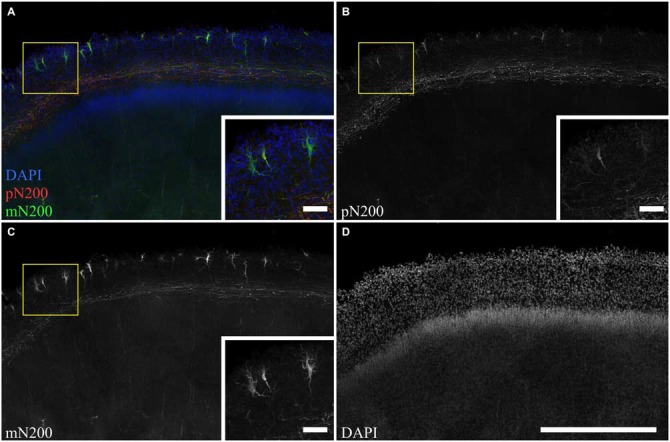
Figure 3.

The difference in C–R cells and plexus immunostaning in the MZ for poly- and monoclonal anti-N200 antibodies. (A–D) Photomicrograph of slice stained with pN200 (red), mN200 (green), DAPI (blue). Box shows the position of the area given at a higher magnification in inserts. Scale bars: (D) 500 μm; inserts in (A–C) 50 μm.
