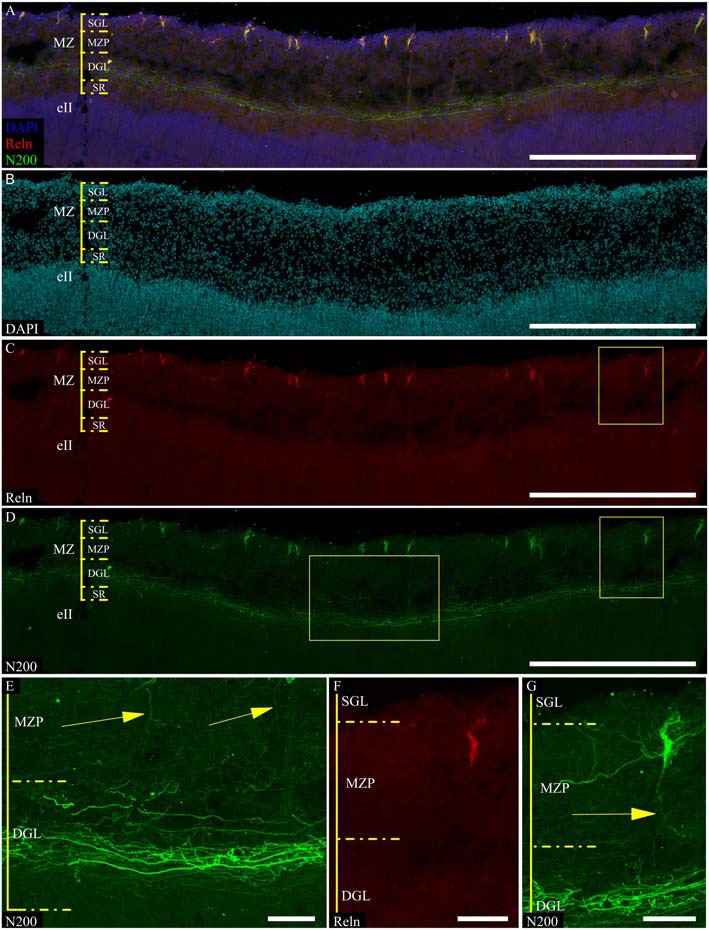
Figure 4.

C–R neurons in the MZ fetal postcentral gyrus at GW 24. (A–D,F,G) C–R cells stained for N200 using monoclonal N200 antibody (green), Reelin (red), DAPI (blue (A), cyan (B), frozen section. Boxes show the position of the area given at a higher magnification in (E–G). (E) N200-positive plexus. Arrows indicate descending C–R cells processes. Scale bars: (A–D) 500 μm; (E–G) 50 μm.
