
Figure 5.
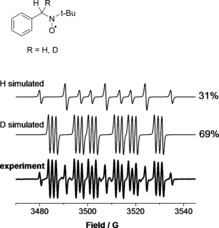
Typical experimental and simulated EPR spectra of PBN radical adducts formed in plasma‐treated H2O or D2O solutions. PBN–H: a N=16.6 G, a H=10.8 G (×2); PBN–D: a N=16.7 G, a H=10.8 G, a D=1.6 G.
Official websites use .gov
A
.gov website belongs to an official
government organization in the United States.
Secure .gov websites use HTTPS
A lock (
) or https:// means you've safely
connected to the .gov website. Share sensitive
information only on official, secure websites.
Typical experimental and simulated EPR spectra of PBN radical adducts formed in plasma‐treated H2O or D2O solutions. PBN–H: a N=16.6 G, a H=10.8 G (×2); PBN–D: a N=16.7 G, a H=10.8 G, a D=1.6 G.