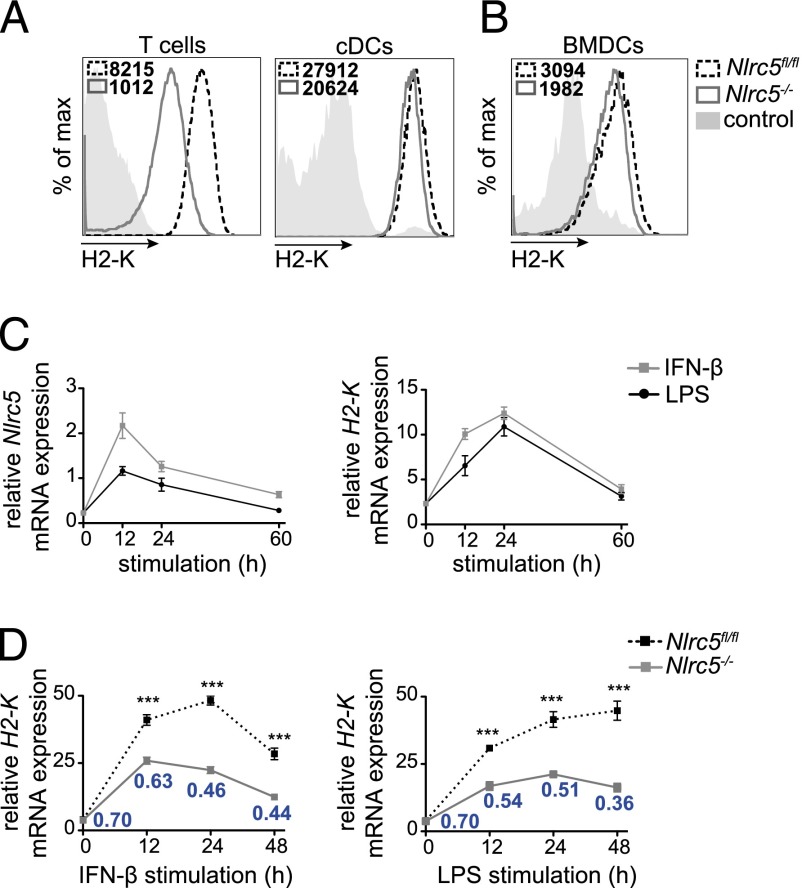
FIGURE 1.
Nlrc5 is upregulated upon inflammatory stimulation and drives H2-K transcription in DCs. (A and B) T lymphocytes (CD3+) and splenic cDCs (CD11chighCD11bint) (A) and BMDCs (CD11c+) (B) from Nlrc5fl/fl and Nlrc5−/− mice were analyzed for surface H2-K expression by flow cytometry. Histograms show a representative example of H2-K fluorescence and mean fluorescence intensity. Results are representative of at least two independent experiments (A and B), with n = 3 mice/group (A). (C) Wild-type BMDCs were stimulated for 12, 24, or 60 h with IFN-β (500 U/ml) or LPS (100 ng/ml). H2-K and Nlrc5 mRNA expression relative to Hprt mRNA were assessed by quantitative PCR. (D) Nlrc5fl/fl and Nlrc5−/− BMDCs were stimulated for 12, 24, and 48 h with IFN-β or LPS. Quantitative PCR was performed to assess H2-K mRNA expression at each time point (relative to Hprt mRNA). Ratios of H2-K expression of Nlrc5−/− to Nlrc5fl/fl BMDCs for each time point are indicated in the graph. Results depict mean ± SD (n = 3 replicates) (C and D) and are representative of at least two (C) and more than three (D) independent experiments. ***p < 0.001.

