FIGURE 2.
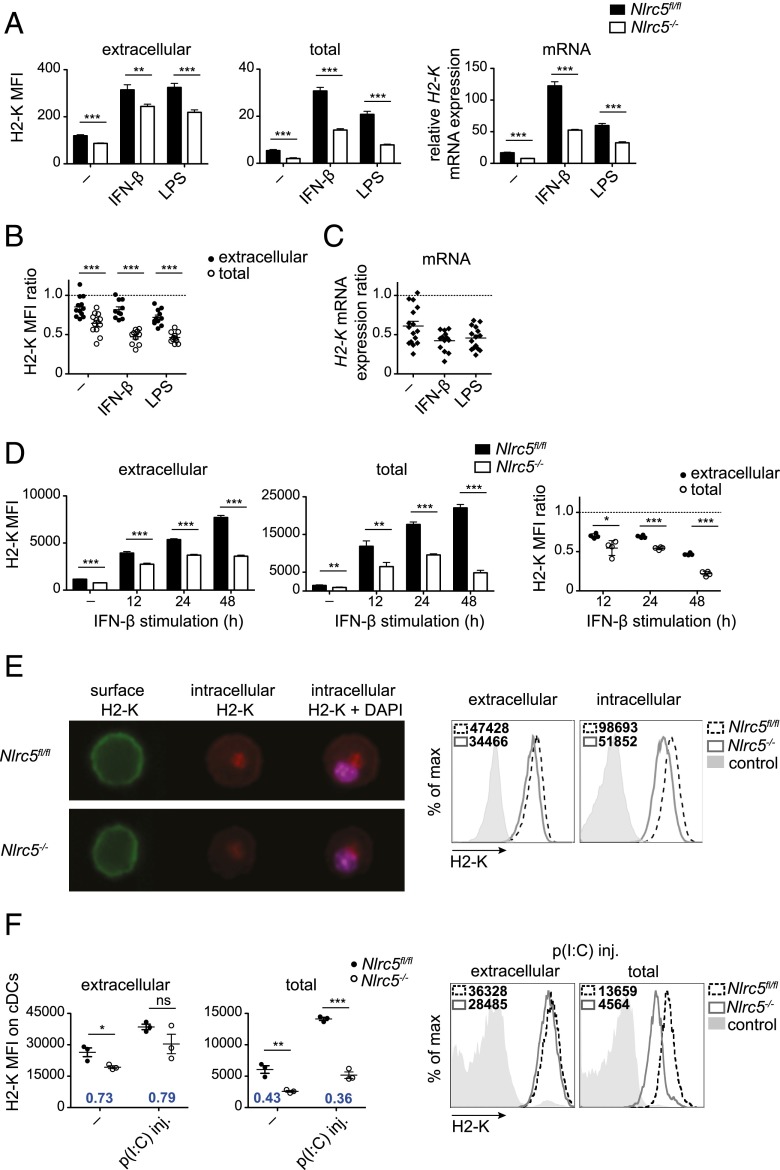
Nlrc5 deficiency affects H2-K mRNA and total protein abundance, but mildly surface expression. (A) Nlrc5fl/fl and Nlrc5−/− BMDCs were stimulated for 24 h with IFN-β, LPS, or left untreated (−). Mean fluorescence intensity (MFI) of surface and total (following permeabilization) H2-K was evaluated by flow cytometry on CD11c+ BMDCs, whereas H2-K mRNA was assessed by quantitative PCR (relative to Hprt mRNA). It is important to note that MFI values of surface and total MHCI cannot be directly compared. Results depict mean ± SD (n = 3 replicates) and are representative of more than three independent experiments. (B and C) Surface, total H2-K, and H2-K mRNA were assessed, as in (A). Ratios of MFIs or relative mRNA abundance of Nlrc5−/− to Nlrc5fl/fl were calculated for surface, total protein (B), and H2-K transcript abundance (C). Results depict mean ± SEM of 10–12 independent experiments (B) and 13–16 independent experiments (C). (D) Nlrc5fl/fl and Nlrc5−/− BMDCs were stimulated for 12, 24, and 48 h with IFN-β or left untreated (−). MFI of surface and total H2-K was evaluated on CD11c+ BMDCs by flow cytometry at the indicated time points. Ratios of MFIs of Nlrc5−/− to Nlrc5fl/fl were calculated for surface and total protein. Results depict mean ± SD (n = 4 replicates) and are representative of more than three independent experiments. (E) Representative ImageStream cytometry images of extracellular, intracellular H2-K, and nuclear staining of CD11c+ Nlrc5fl/fl and Nlrc5−/− BMDCs 24 h post-LPS stimulation. Histograms illustrate surface and intracellular H2-K fluorescence on >10,000 events. Results are representative of three independent experiments. Original magnification ×40. (F) Nlrc5fl/fl and Nlrc5−/− mice were injected i.p. with 100 μg poly(I:C), or left untreated (−). Splenic cDCs were analyzed 24 h later for surface and total H2-K expression. H2-K MFI values of Nlrc5−/− to Nlrc5fl/fl for extracellular as well as total fluorescence are depicted in the graphs. Histograms show representative examples of surface and total H2-K fluorescence. Results illustrate mean ± SEM (n = 3 mice/group) and are representative of at least two independent experiments. *p < 0.05, **p < 0.01, ***p < 0.001.

