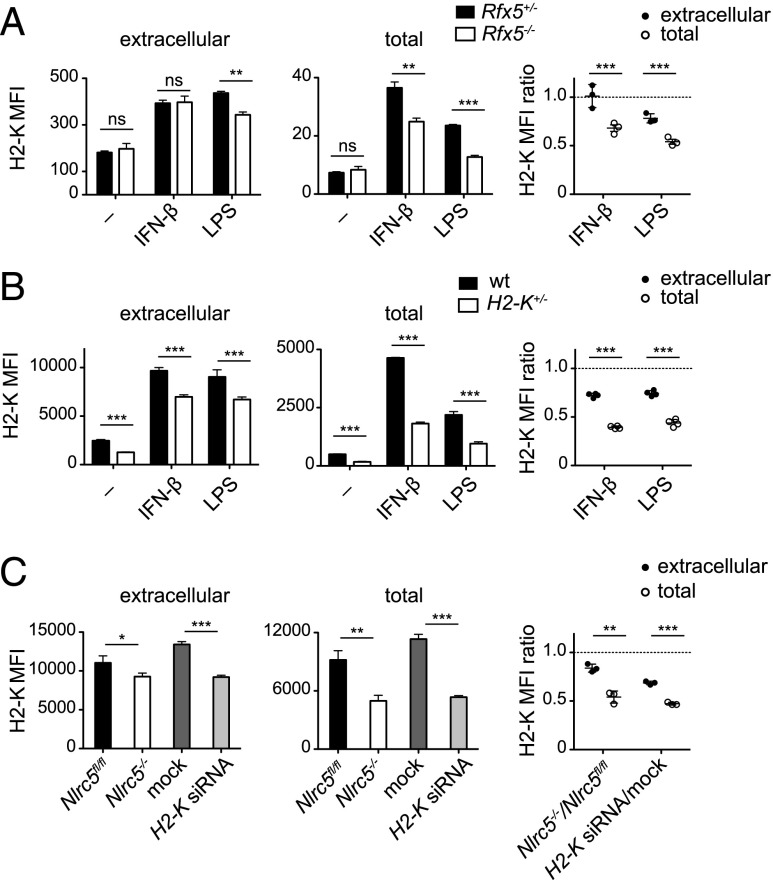
FIGURE 3.
A general, NLRC5-independent mechanism compensates H2-K surface levels. (A) Rfx5+/− and Rfx5−/− BMDCs were stimulated with either IFN-β, LPS, or left untreated (−). Mean fluorescence intensities (MFIs) of extracellular and total H2-K were evaluated 24 h poststimulation by flow cytometry on CD11c+ BMDCs. Ratios of H2-K MFI values of Rfx5−/− to Rfx5+/− for extracellular as well as total fluorescence are depicted in the graph. (B) Wild type and H2-K+/− BMDCs were treated and analyzed as in (A). (C) Nlrc5fl/fl BMDCs were transfected with either 5 nM negative control small interfering RNA (mock, dark gray bars) or 5 nM H2-K–specific small interfering RNA (H2-K siRNA, light gray bars). Following transfection, cells were stimulated with IFN-β. In parallel, untransfected Nlrc5fl/fl and Nlrc5−/− BMDCs stimulated with IFN-β for 24 h were assessed. Surface and total H2-K levels were analyzed on CD11c+ BMDCs after 24 h. Ratios of MFI values of Nlrc5−/− to Nlrc5fl/fl and for H2-K small interfering RNA- to mock-transfected cells for extracellular and total fluorescence are illustrated on the right. Results represent mean ± SD of n = 3 technical replicates (A and C), n = 4 technical replicates (B), and are representative of at least two (B) or three (A and C) independent experiments. *p < 0.05, **p < 0.01, ***p < 0.001.

