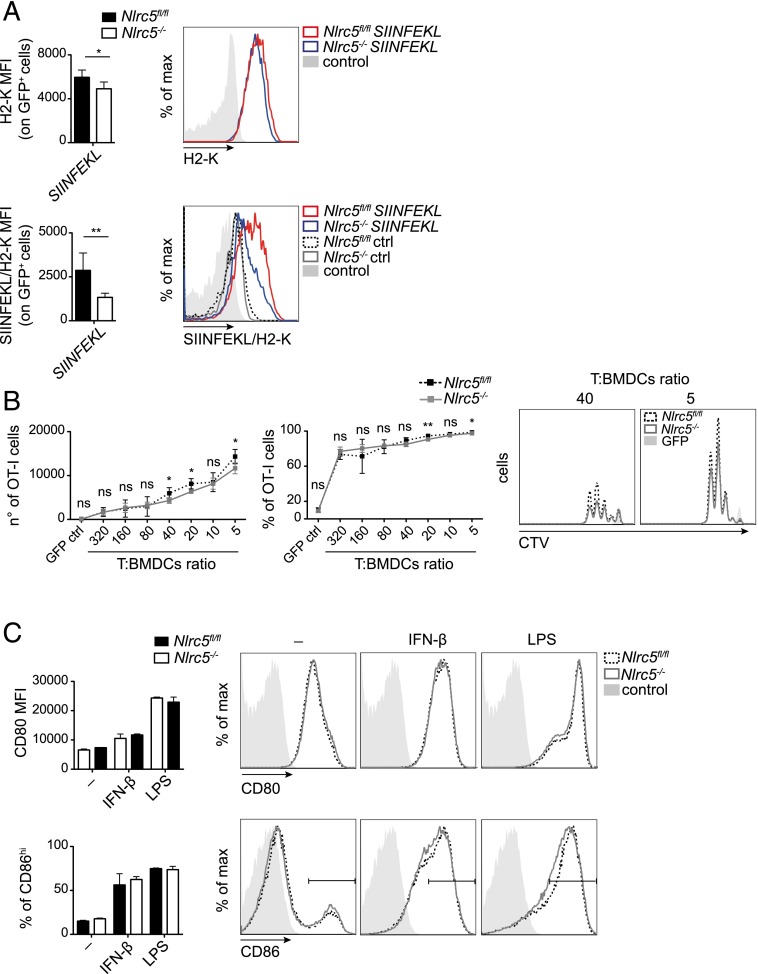
FIGURE 5.
Nlrc5-deficient DCs are defective in presenting endogenous Ags, but not in T cell priming. (A and B) Nlrc5fl/fl or Nlrc5−/− BMDCs were transfected with either GFP-SIINFEKL (SIINFEKL) or GFP control (ctrl) mRNA, as negative control, 12 h post-LPS stimulation. Mean fluorescence intensities (MFI) of H2-K and SIINFEKL-complexed H2-K (SIINFEKL/H2-K) on CD11c+ GFP+ cells were evaluated 8 h posttransfection by flow cytometry. Histograms on the right show representative examples thereof. (B) CTV-labeled OT-I T cells were cocultured 2 d with Nlrc5fl/fl or Nlrc5−/− BMDCs treated as in (A) with the indicated T cell/BMDCs ratios. Numbers, percentages, and a representative example of OT-I T cell proliferation are depicted. Results represent mean ± SD (n = 5). (A and B) are representative of more than three (A) and two (B) independent experiments. (C) MFI of CD80 and percentage of CD86high cells on CD11c+ Nlrc5fl/fl or Nlrc5−/− BMDCs stimulated with IFN-β or LPS for 24 h were assessed by flow cytometry. Histograms show a representative example of CD80 and CD86 fluorescence as detected by FACS. Results represent mean ± SD (n = 4 replicates) and more than three independent experiments (C). *p < 0.05, **p < 0.01.

