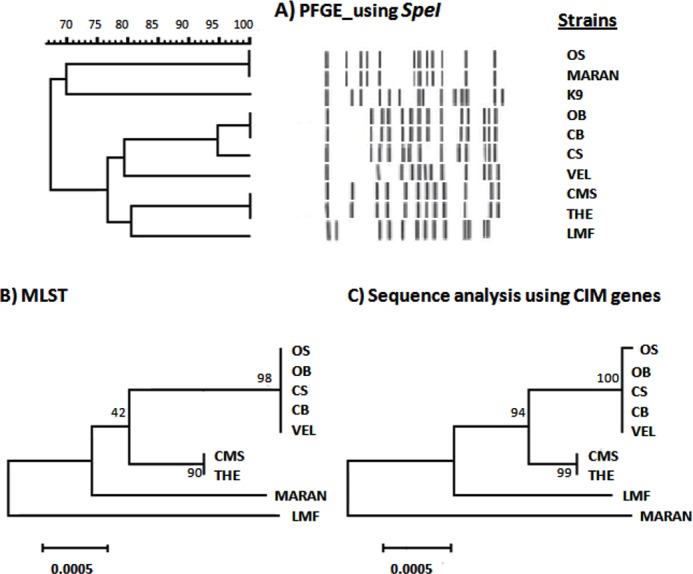
Figure 1. Comparison between PFGE, CIM genes and MLST profiles of nine Burkholderia pseudomallei isolates from Malaysia.

(A) Dendrogram generated using UPGMA based on Dice coefficients showed two clusters at 65% similarity. K9 was the B. pseudomallei reference strain, K96243. (B) Maximum likelihood tree generated using 7 MLST genes showed the close relationship of the colony variants (OB, OS; CB, CS) with the other clinical isolates and LMF and MARAN as outgroups. (C) The relationship of the Malaysian isolates were also depicted using maximum likelihood tree based on sequence analysis of CIM genes. The tree showed the slight difference of OS with its big colony variant, OB. The values on the nodes indicate the bootstrap value with 1,000 times resampling for (B) and (C).
