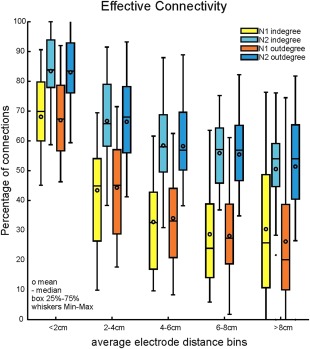
Figure 4.

The effect of distance on CCEP connectivity. The bars with lighter colors illustrate the normalized indegree as a function of distance, while the bars with darker colors show the normalized outdegree. CCEP distributions are computed in 2 cm bins. Errorbars denote minimum and maximum values. The difference between N1 and N2 is significant in every distance bin (P < 0.05, Kolmogorov–Smirnov) and both for indegree and outdegree. The decrease in connectivity is also significant between (<2 cm and >8 cm) the bins (P < 0. 01; ANOVA Kruskal–Wallis test) for indegree and outdegree and for N1 and N2 as well. [Color figure can be viewed in the online issue, which is available at http://wileyonlinelibrary.com.]
