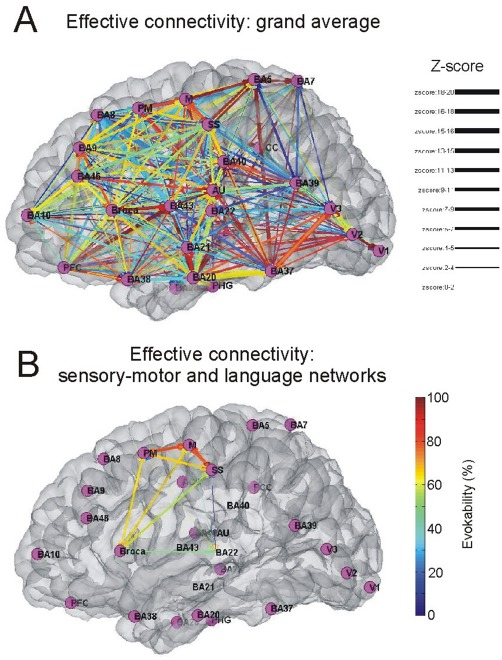
Figure 8.

Expressing directional connections between areas using the group average. A: Graph shows the connections between BAs, based on the connectivity matrix derived from the stimulation data. Grand mean average of all patients is shown for the N1 peak. B: the connections between the somatosensory and motor and the areas involved in speech and comprehension are highlighted only. The color of the edges represent the evokability (warmer colors represent higher percentage of patients exhibitng the connection), the width of the edge highlights the average z‐score between the two areas.
