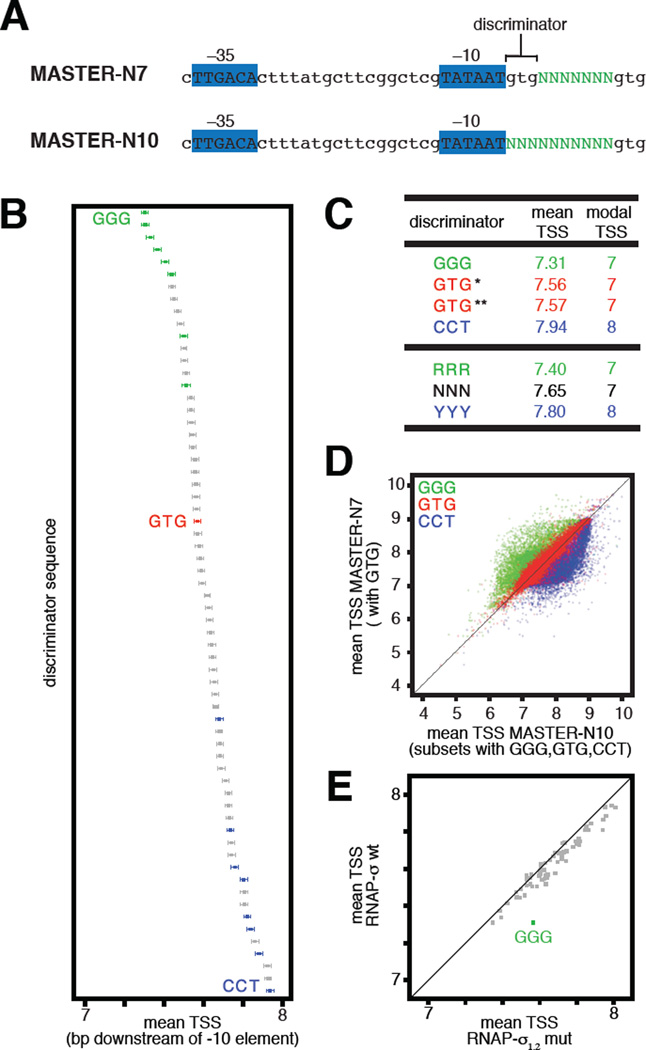
Fig. 1. Sequences upstream of TSS region affect TSS selection.
(A) Promoter sequences analyzed in MASTER-N7 (2) and MASTER-N10. Promoter -35, -10, and discriminator elements are indicated. Green, randomized nucleotides.
(B) Effect of discriminator on position of TSS (numbered in bp downstream of -10 element). Data show means and 99.9% confidence intervals for each of the 64 discriminator sequences (~16,000 templates analyzed for each discriminator). Green, GGG and other RRR discriminators; blue, CCT and other YYY discriminators; red, GTG discriminator.
(C) Mean and modal TSS. *, GTG data from MASTER-N7; **, GTG data from MASTER-N10.
(D) Upstream and downstream shifts in TSS selection with the ~16,000 GGG and ~16,000 CCT discriminators (green and blue, respectively) relative to the ~16,000 GTG discriminators (red).
(E) Effect of σ1.2-discriminator interactions on TSS selection (downstream shift in mean TSS for ~16,000 GGG-discriminator templates on replacement of σ by σ1.2 mutant).

