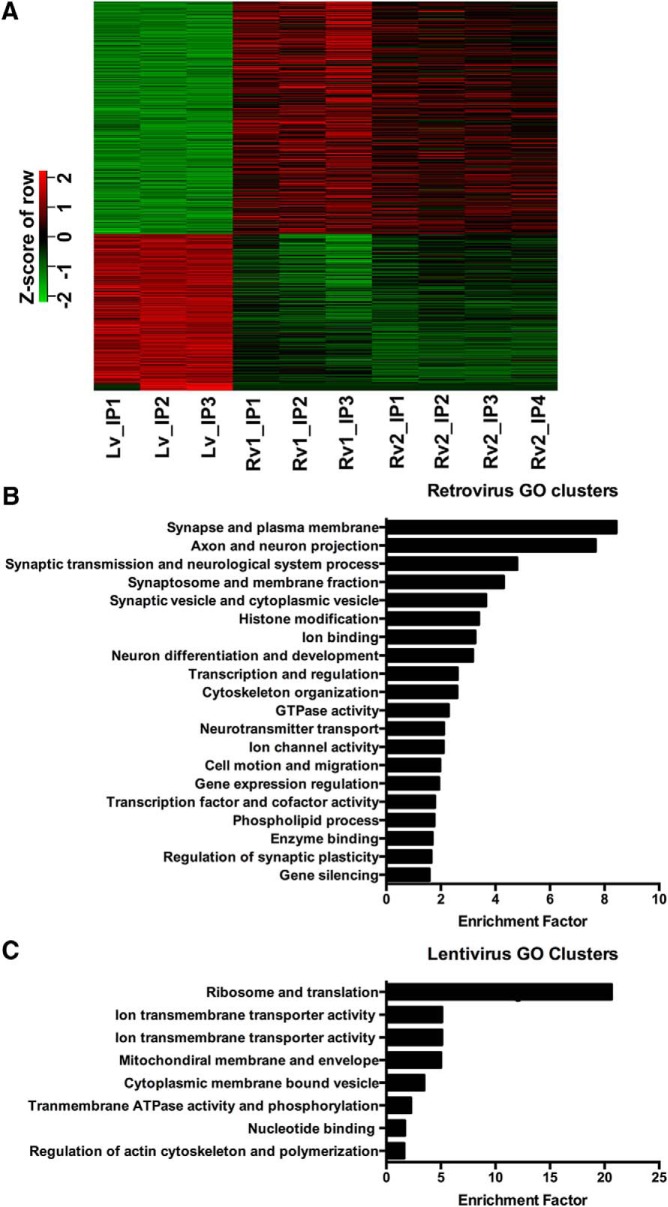
Figure 4.
Differential expression of mRNA between immature and mature DG granule cells. A, The retroviral datasets 1 and 2 were separately compared with the lentiviral dataset using a heat map. Each comparison generated a list of significantly changed genes. Both lists were merged into a new single list by requiring that the genes appeared in both lists. The heat map was plotted based on this new list. The 457 genes in the top half of the heat map were specifically enriched in the retroviral datasets. The 305 genes in the bottom half of the heat map were specifically enriched in the lentiviral dataset. B, C, The top enriched ontological clusters of DAVID categories are reported for the retroviral (B) and lentiviral (C) datasets.

