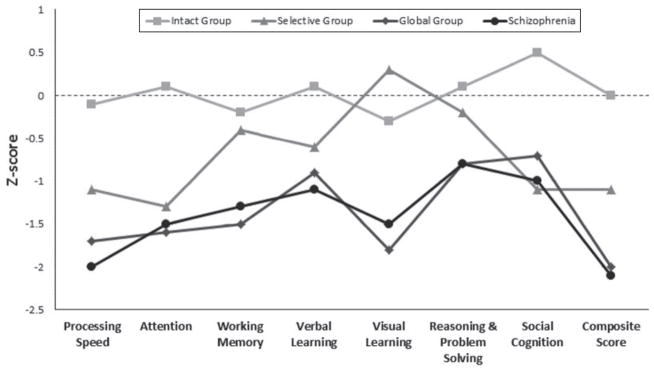
Fig. 2.
Neurocognitive profiles of bipolar disorder clusters and the schizophrenia sample. The X-axis indicates the MATRICS Consensus Cognitive Battery (MCCB) domains. The Y-axis depicts a Z-scale score with a mean of 0 and a standard deviation of 1. Z scores were computed based upon the healthy control sample. Patients are divided into lines based on scoring for each cognitive domain. Statistical comparisons among groups are specified in Table 2.

