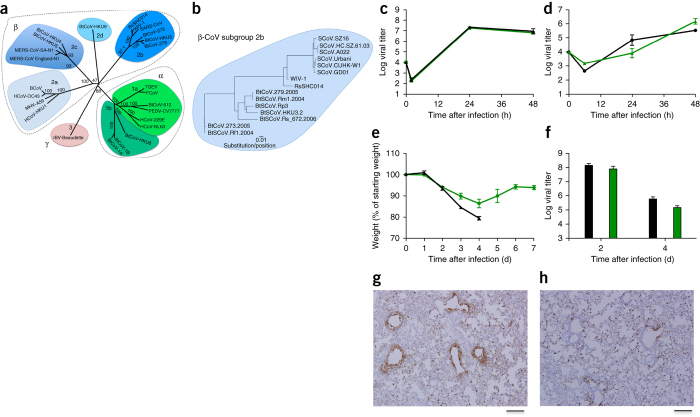
Figure 1. SARS-like viruses replicate in human airway cells and produce in vivo pathogenesis.
(a) The full-length genome sequences of representative CoVs were aligned and phylogenetically mapped as described in the Online Methods. The scale bar represents nucleotide substitutions, with only bootstrap support above 70% being labeled. The tree shows CoVs divided into three distinct phylogenetic groups, defined as α-CoVs, β-CoVs and γ-CoVs. Classical subgroup clusters are marked as 2a, 2b, 2c and 2d for the β-CoVs and as 1a and 1b for the α-CoVs. (b) Amino acid sequences of the S1 domains of the spikes of representative β-CoVs of the 2b group, including SARS-CoV, were aligned and phylogenetically mapped. The scale bar represents amino acid substitutions. (c,d) Viral replication of SARS-CoV Urbani (black) and SHC014-MA15 (green) after infection of Calu-3 2B4 cells (c) or well-differentiated, primary air-liquid interface HAE cell cultures (d) at a multiplicity of infection (MOI) of 0.01 for both cell types. Samples were collected at individual time points with biological replicates (n = 3) for both Calu-3 and HAE experiments. (e,f) Weight loss (n = 9 for SARS-CoV MA15; n = 16 for SHC014-MA15) (e) and viral replication in the lungs (n = 3 for SARS-CoV MA15; n = 4 for SHC014-MA15) (f) of 10-week-old BALB/c mice infected with 1 × 10⁴ p.f.u. of mouse-adapted SARS-CoV MA15 (black) or SHC014-MA15 (green) via the intranasal (i.n.) route. (g,h) Representative images of lung sections stained for SARS-CoV N antigen from mice infected with SARS-CoV MA15 (n = 3 mice) (g) or SHC014-MA15 (n = 4 mice) (h) are shown. For each graph, the center value represents the group mean, and the error bars define the s.e.m. Scale bars, 1 mm.

