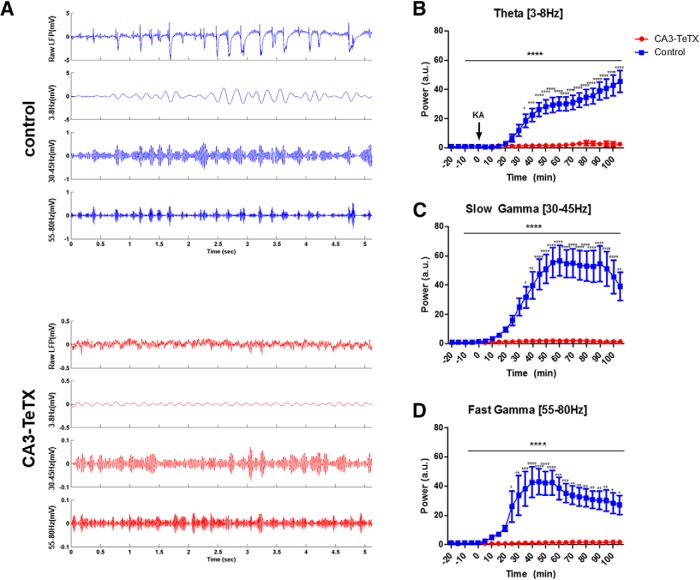
Figure 3.
Loss of CA3 output prevents increases in CA1 oscillations induced by KA. A, Example LFP recordings in CA1 stratum radiatum from a control (blue; top) and CA3-TeTX (red; bottom) mouse 60 min after kainic acid injection. For each genotype the top panel shows the raw LFP, the second panel the theta band filtered LFP, the third the slow gamma filtered LFP, and the bottom the fast gamma filtered LFP. Note the scale in the control traces is 10× that of the CA3-TeTX mice. KA injection lead to a significant increase in power in the (B) theta band and the (C) slow gamma band 35 min postinjection, and in the (D) fast gamma band 25 min following KA. ****p<0.0001, ***p<0.001, **p<0.01, *p<0.05. Control, n=22 (control ON DOX, n=12; control OFF DOX, n=4; CA3-TeTX ON DOX, n=6); CA3-TeTX, n=16.

