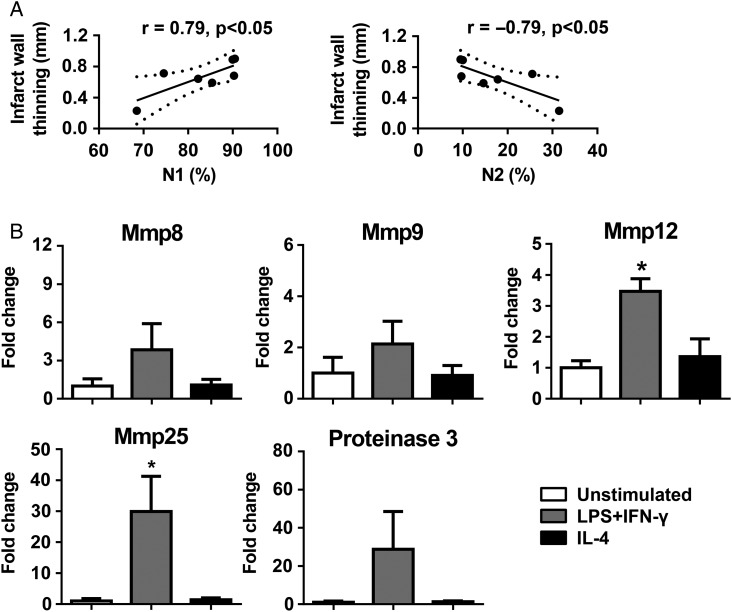
Figure 7.
N1 neutrophils were a source of LV wall thinning due to high levels of Mmp12 and Mmp25. (A) At day 7 post-MI, N1 positively and N2 negatively correlated with infarct wall thinning. Infarct wall thinning = (days 0–7) LV posterior wall thickness in systole. n = 7 per group. Pearson's correlation analysis was used. (B) N1 neutrophils stimulated by LPS + IFN-γ expressed higher levels of Mmp12 and Mmp25, compared with unstimulated cells. The data were expressed as fold change (normalized to the unstimulated group). n = 4 per group. *P < 0.05 vs. unstimulated. One-way ANOVA was used.

