Figure 2.
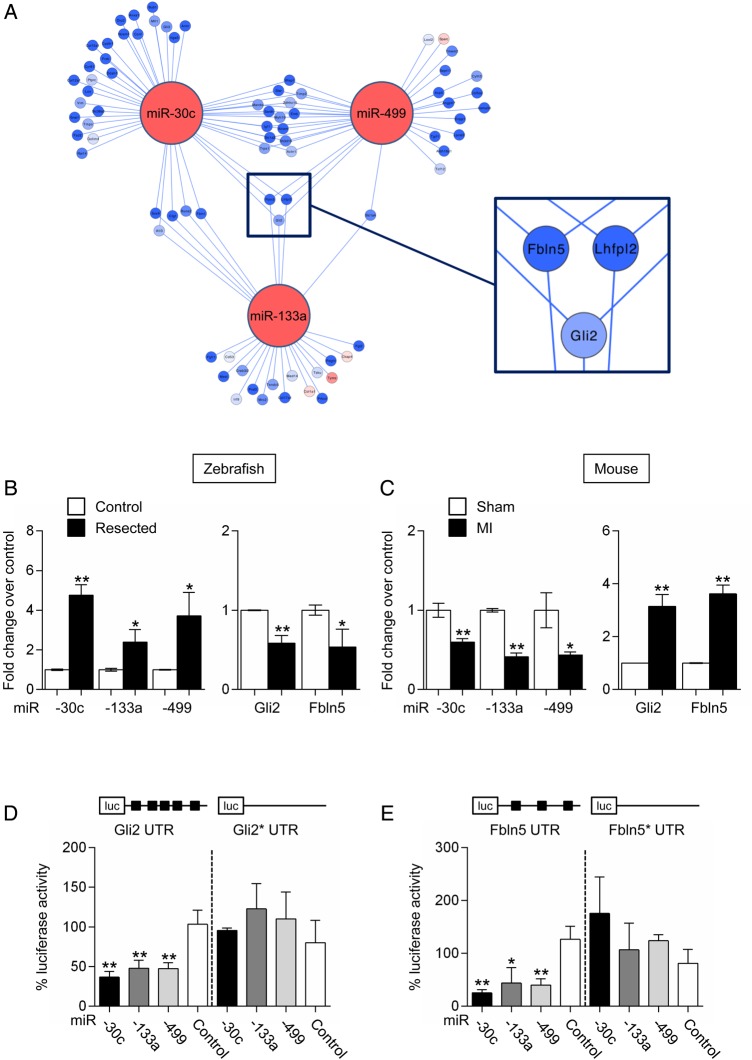
miR-30c-, miR-133a-, and miR-499-dependent subnetwork. (A) Subnetwork around miR-30c, miR-133a, and miR-499. Node colours represent changes in expression between the two injury models: red lines indicate greater up-regulation or lesser down-regulation in the injured zebrafish heart as compared with the injured mouse heart; blue indicates greater down-regulation or lesser up-regulation in the injured zebrafish heart as compared with the injured mouse heart. Node colour in target genes is proportional to the log fold change. Edge colours represent positive (red) and negative (blue) correlation. Three genes, Fbln5, Lhfpl2, and Gli2, are potential targets for all three miRNAs; (B) miR-30c, miR-133a, and miR-499 expression (left panel), and of Gli2 and Fbln5 expression (right panel) in control and resected zebrafish hearts. Data are expressed as mean ± SEM; n ≥ 4 for each group; *P < 0.05, **P < 0.01. (C) miR-30c, miR-133a, and miR-499 expression (left panel), and of Gli2 and Fbln5 expression (right panel) in sham-operated and infarcted mouse hearts. Data are expressed as mean ± SEM; n ≥ 6 for each group; *P < 0.05, **P < 0.01. (D) Luciferase activity measured in COS-7 cells 48 h after transfection with a luciferase reporter containing the Gli2 3′ UTR together with plasmids expressing either miR-133a, miR-30c, or miR-499. Gli2*UTR indicates a reporter containing a mutated form of Gli2 3′ UTR. (E) Luciferase activity measured in COS-7 cells 48 h after transfection with a luciferase reporter containing the Fbln5 3′ UTR together with plasmids expressing either miR-133a, miR-30c, or miR-499. Fbln 5*UTR indicates a reporter containing a mutated form of Fbln5 3′ UTR. pN3-miRdsRED2x-WPRE-eGFP was used as miRNA control. Data are expressed as mean ± SEM. Experiments were performed in triplicates; n ≥ 3; *P < 0.05, **P < 0.01. See also Supplementary material online, Table S1, S3, and S7.

