
Figure 2.
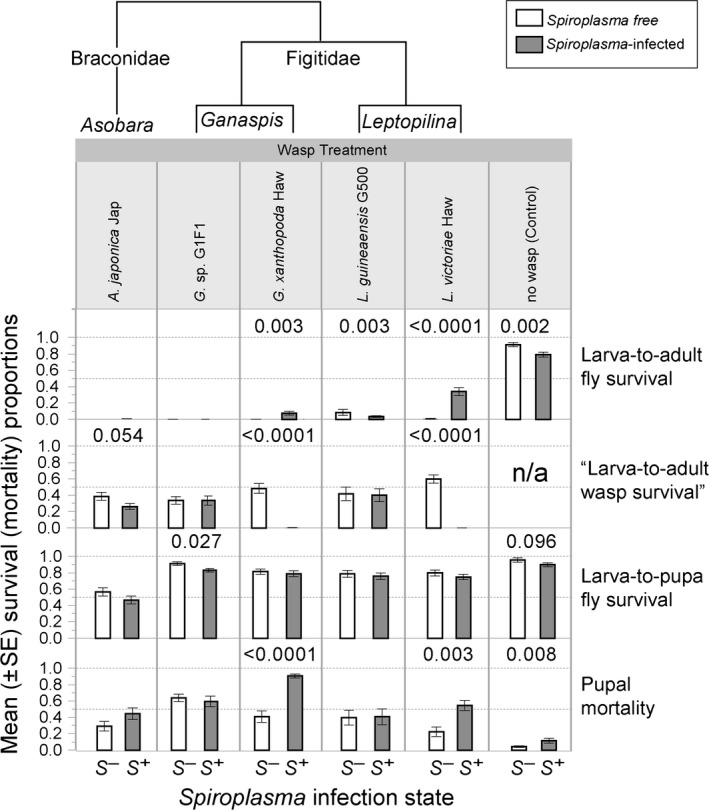
Fitness effects of Spiroplasma MSRO in the presence and absence of five wasp species representing three genera from two families. Mean ± Standard Error for four survival/mortality measures. Open bars = Spiroplasma‐free (S −) treatments; Gray bars = Spiroplasma‐infected (S +) treatments. The cladogram above indicates phylogenetic relationships (based on Kacsoh and Schlenke 2012). P‐values for significant (P < 0.05) or borderline nonsignificant effects of Spiroplasma infection are shown. Dashed horizontal lines = 50 and 100% Y‐axis values.