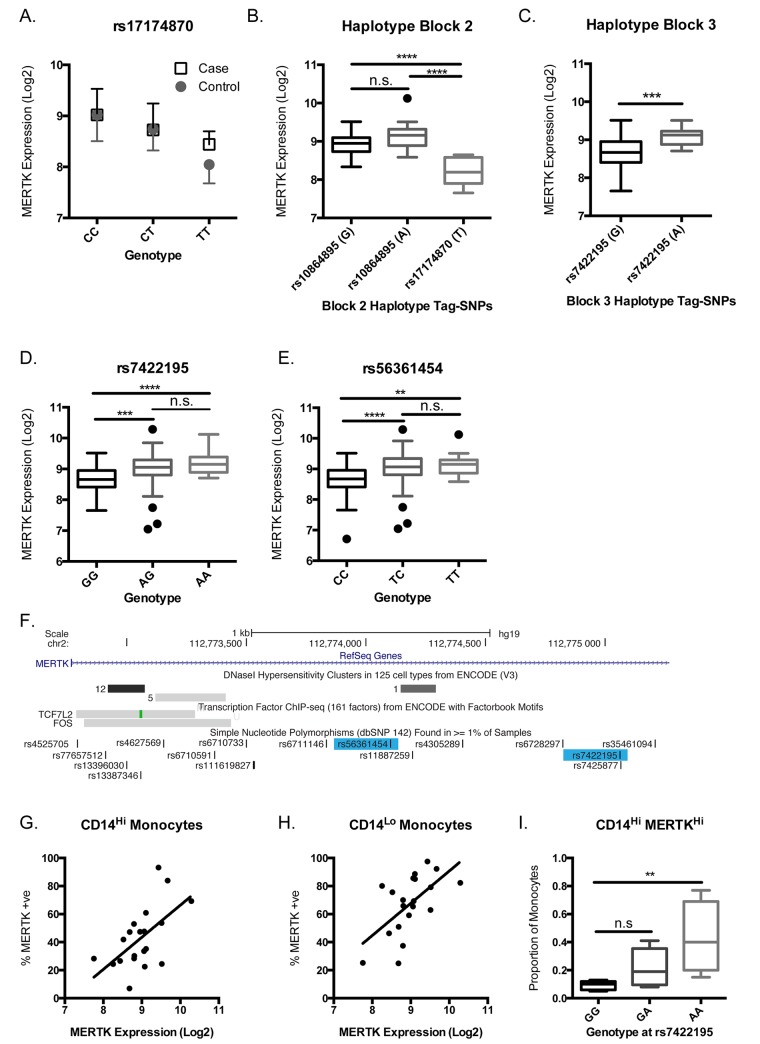
Fig 6. Expression of MERTK in monocytes is genotype dependent.
Immune cell subsets were purified from peripheral blood mononuclear cells obtained from MS cases and healthy controls using magnetic cell sorting. (A) Gene expression was measured using the Affymetrix Human ST1.0 array. The genotype for each participant was determined using Immunochip (Illumina) and expression data stratified by genotype at rs17174870. Expression of the MERTK gene in monocytes was significantly associated with genotype (p = 2.215 x 10⁻⁵, padj = 0.006) but not with phenotype (p>0.05). We then stratified individuals carrying various combinations of the haplotype blocks identified in association testing and stratified expression for individuals homozygous for those in block 2 (B) and block 3 (C), with the tag-SNP and relevant allele shown for each haplotype. (B) Individuals homozygous for the haplotype tagged by rs17174870(T) showed significantly lower MERTK expression compared with haplotypes A or B (p<0.0001). (C) Individuals homozygous for the haplotype tagged by rs7422195(A) showed significantly increased expression of MERTK compared with the haplotype tagged by the alternative (G) allele. (D) When samples are stratified by rs7422195 expression of MERTK is increased with increased copies of the minor (A) allele [Mean expression±SD: 8.654±0.369 (GG), 9.012±0.5514 (AG) p<0.001 vs GG, 9.186±0.3434 (AA) p<0.0001 vs GG] (E) When samples are stratified by rs56361454 expression of MERTK is increased with increased copies of the minor (T) allele [Mean expression±SD: 8.655±0.4489 (CC), 9.041±0.5529 (CT) p<0.0001 vs CC, 9.139±0.3603 (TT) p<0.01 vs CC]. (F) Schematic of the genomic region surrounding rs7422195 and rs56361454 showing transcription factor binding sites and DNase sensitive regions. MERTK expression on the surface of monocytes was determined using flow cytometric analysis of whole blood and correlated with MERTK gene expression. MERTK surface expression was significantly correlated with gene expression in (G) CD14Hi (r2 = 0.3434, p = 0.0066) and (H) CD14Lo (r2 = 0.3624, p = 0.005) monocytes. (I) The proportion of CD14HiMERTKHi monocytes is increased with increasing dose of the minor (A) allele of rs7422195 (p<0.01 GG vs AA). All grouped expression data are plotted as Tukey box and whiskers.

