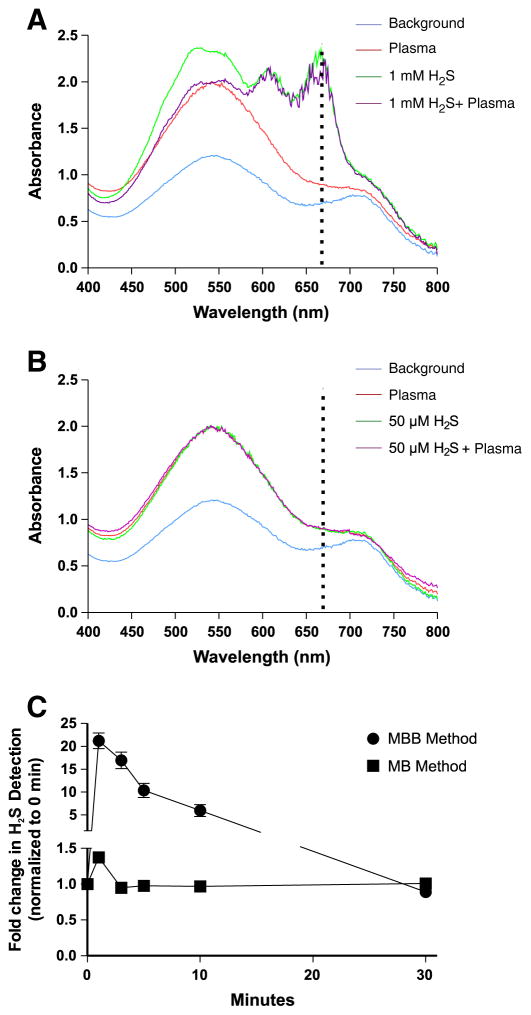
Fig. 10.
Comparison of hydrogen sulfide analysis between MBB and MB methods. (A) The peak of hydrogen sulfide in the range 660–680 nm, using the MBB method. (B) The peak of hydrogen sulfide in the range 660–680 nm, using the MB method. (C) The difference in detection efficiency of the MBB and MB methods after administration of Na2S to a C57Bl/6 J mouse. n=3.

