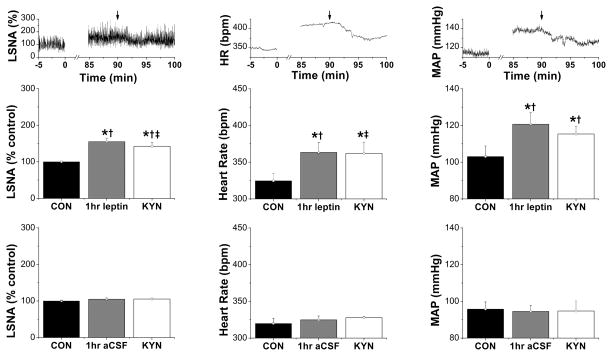
Figure 3.
LSNA, HR, and MAP were increased 1 hr following icv injection of leptin, and these changes were partially reversed by bilateral nanoinjection of KYN into the PVN 30 min later. Top: Representative experiment showing icv leptin + PVN KYN (at arrows). Groups are: middle, icv leptin + PVN KYN (n=6); bottom, icv aCSF + PVN KYN (n=4). *: P<0.05, compared to baseline control values (CON); †: P<0.05 compared to icv aCSF at the same time; ‡: P<0.05, compared to icv leptin plus PVN aCSF (Figure 1A), at the same time.

