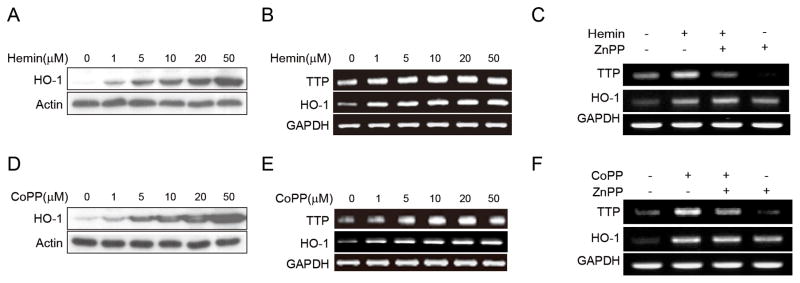
Figure 4. Induction of HO-1 increases TTP levels in macrophages.
(A & B) RAW 264.7 cells were treated with the indicated concentration of hemin for 18h. HO-1 levels were analyzed by Western blot (A) and semi-qRT-PCR (B) and TTP levels were analyzed by semi-qRT-PCR (B). (C) RAW 264.7 cells were pretreated with 20μM ZnPP for 30min and further incubated with 10 μM hemin for 18h. The levels of TTP and HO-1 were analyzed by semi-qRT-PCR. (D & E) RAW 264.7 cells were treated with the indicated concentration of CoPP for 18h. HO-1 levels were analyzed by Western blot (D) and semi-qRT-PCR (E) and TTP levels were analyzed by semi-qRT-PCR (E). (F) RAW 264.7 cells were pretreated with 20μM ZnPP for 30min and further incubated with 10μM CoPP for 18h. The levels of TTP and HO-1 were analyzed by semi-qRT-PCR.

