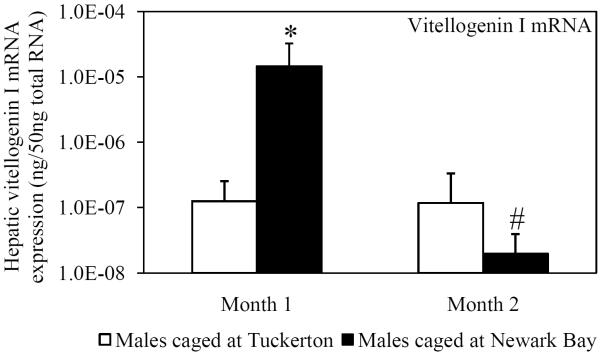
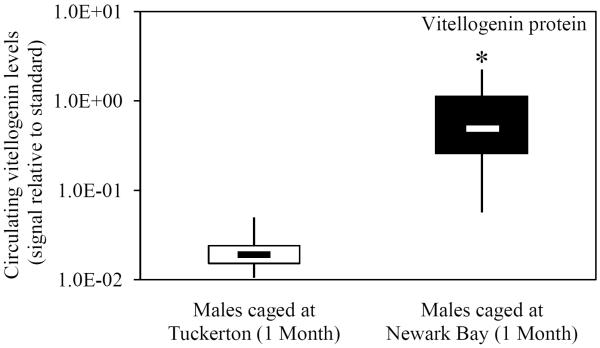
Fig. 1.
(A) Hepatic vitellogenin mRNA expression for naïve males caged at Tuckerton and Newark Bay for 1 and 2 months. (B) Circulating levels of vitellogenin protein in naïve Tuckerton males after 1 month. No vitellogenin protein was detected in males after 2 months. Killifish were caged starting May 24th, 2009, for 1 or 2 months duration with collections on June 22nd and July, 21st, 2009. Bar graphs are presented as mean ± standard deviation. The box-and-whisker plot represents the minimum and maximum values and the median, lower and upper quartiles. N = 6-7 individuals per group. *Significantly different from Tuckerton (p ≤ 0.05). #Significantly different between months within the respective site and gender (p ≤ 0.05).


