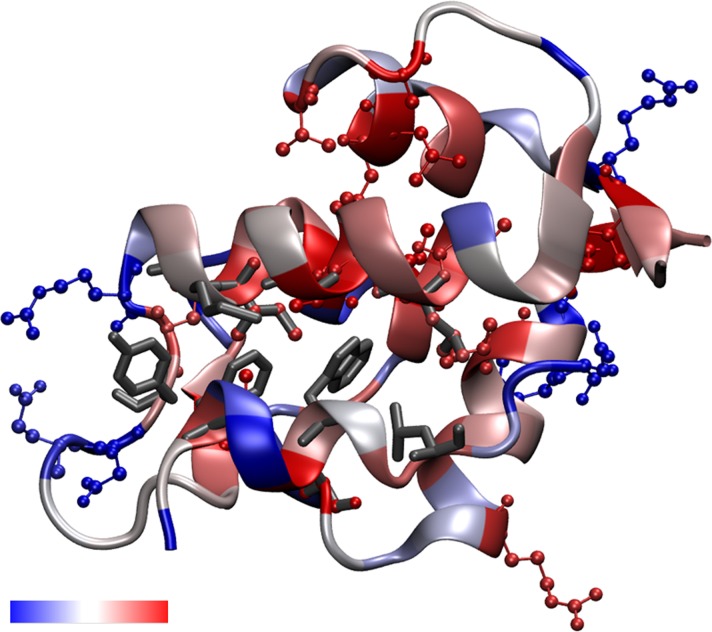
Fig 2. MUMBO energy score for total mutagenesis mapped to the 1YCR crystal structure.
The p53 peptide is bound in the foreground. In red and blue ball-and-sticks, significantly energetically constrained and energetically mutable residues are shown, respectively, and are listed in Table 1. Residues shown in sticks are previously identified hot-spots determined through alanine-scanning mutagenesis (listed in Table 1) including the three directly interacting p53 residues. The backbone itself is colored by each position’s z-score, showing the relative constraint of each position along the backbone. The color scale is shown in the accompanying color scale bar, which ranges from energetically mutable (blue) to energetically constrained (red).

