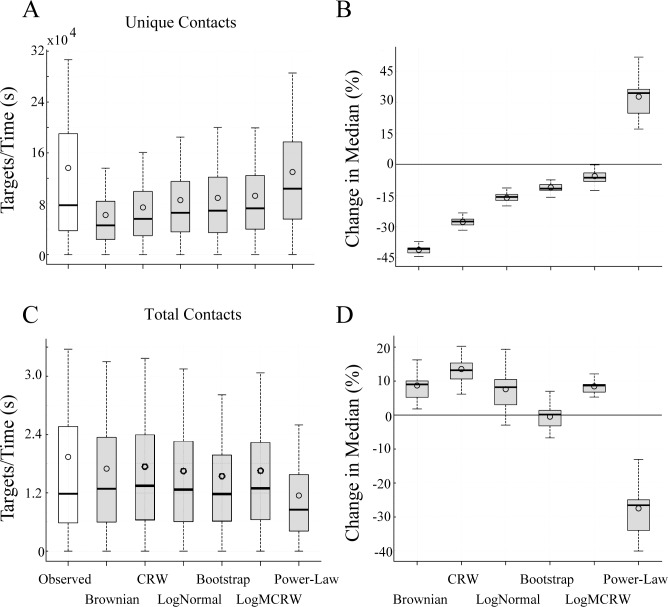
Fig 3. T cell search balances unique and total contacts with targets.
Interquartile boxplots show search efficiency for DCs in 10 μm radius clusters. Panels (A) and (B) show unique contact efficiency; (C) and (D) show total contact efficiency. (A) and (C) show 1000 efficiency samples for each of the 41 fields. (B) and (D) compare the percent change in median search efficiency for each candidate search model relative to observed T cell search (indicated by the line at 0). See Tables 3 and 4 for other target distributions and significance values. Outliers are not shown for clarity.

