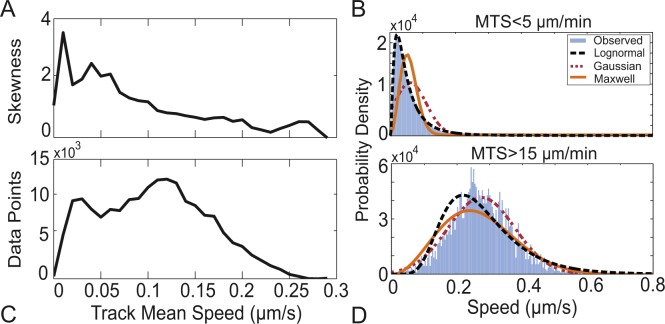
Fig 4. T cells moving at different speeds show different movement patterns.
(A) Skew of step length distribution as a function of track mean speed and (C) the number of data points as a function of track mean speed. Tracks with mean track speeds (MTS) less than 5μm/min (B) and greater than 15μm/min (D) were selected to illustrate different MLE model fits for fast and slow tracks (for fits see Table 5).

