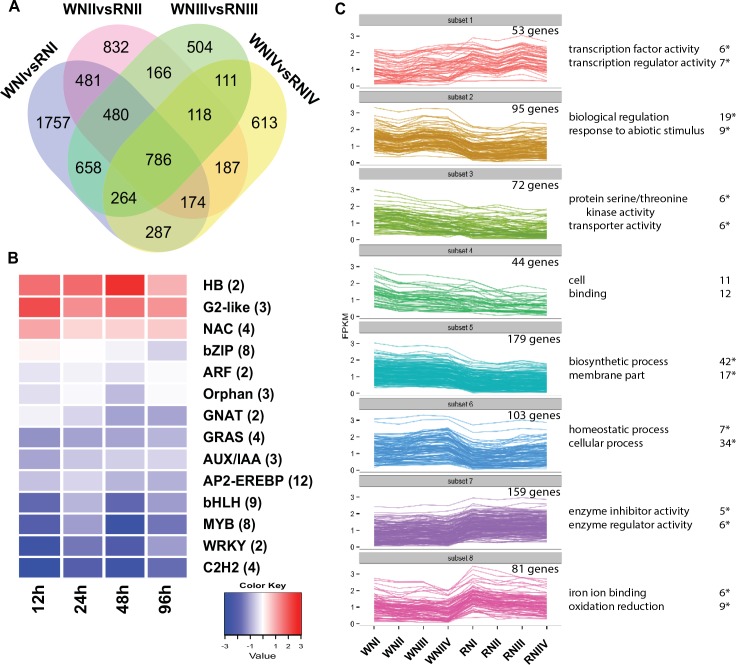
Fig 2. RNA-Seq analysis of rtcs and wild-type roots transcriptome under normal-N condition.
(A) Venn diagram analysis of DEGs between wild-type and rtcs at four developmental time points. (B) Co-modulated differential expression transcription factors (TFs) between wild-type and rtcs at four time points. TFs were grouped by family and the number of differential expression TFs is indicated. Each column represents average expression differences across the TF family at one time point. (C) Clustering co-modulated DEGs based on the expression profiles (FPKM values were log10-transformed). The top GO terms and corresponding DEGs number are shown on the right side, “*” represents significant enrichment (FDR <0.05).

