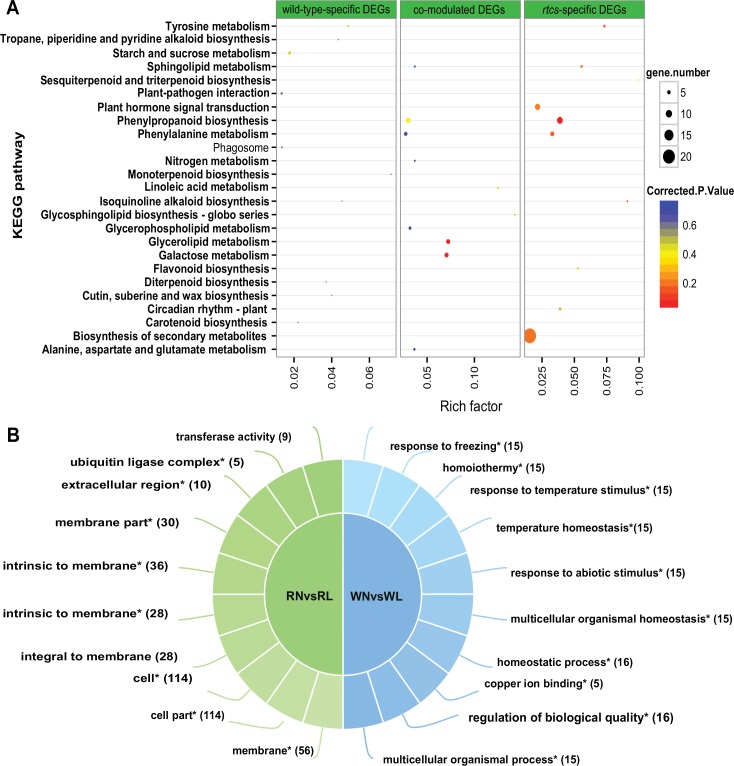
Fig 4. Gene annotation and functional enrichment analysis for DEGs in response to N-deficiency.
(A) Cross-comparison of pathway enrichment analysis among DEGs in response to N-deficiency. The y-axis corresponds to the KEGG pathway, and the x-axis shows the enrichment factor. The color of the dot represents the q-value, and the size of the dot represents the number of DEGs mapped to the reference pathways. (B) Cross-comparison of enriched GO terms among DEGs in response to N-deficiency. The top GO terms and corresponding DEGs number are shown on the right side, “*”represents significant enrichment (FDR <0.05).

