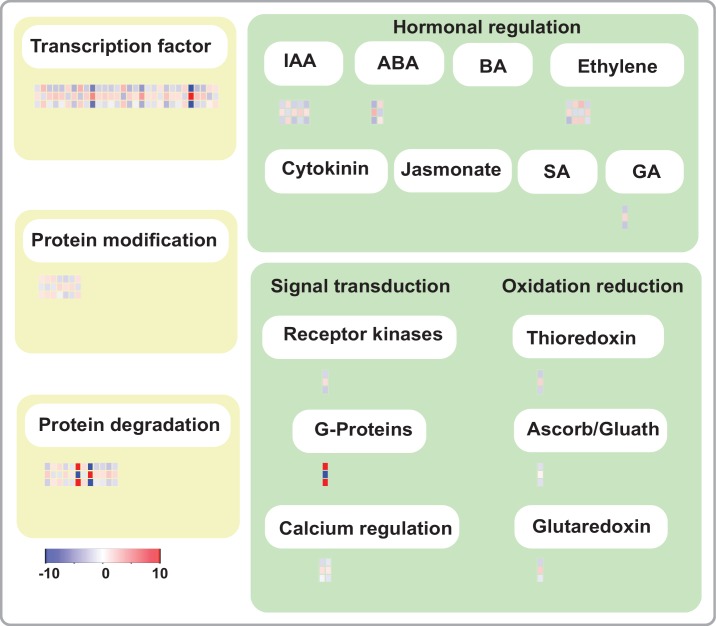
Fig 5. Gene annotation of co-modulated DEGs, analyzed and visualized by MapMan.
Each block represents average expression changes for one gene. Three rows of blocks are shown to demonstrate wild-type-specific N-deficiency DEGs, rtcs-specific N-deficiency DEGs and rtcs-dependent common DGEs from bottom to top.

